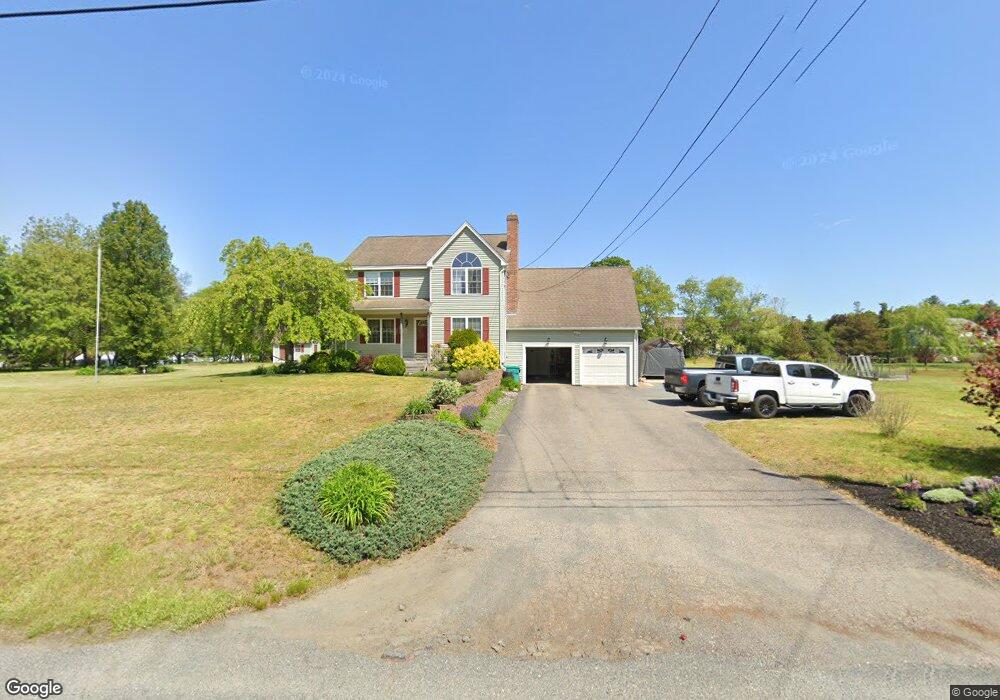
12 Henry Legg Rd Uxbridge, MA 01569
Estimated Value: $596,000 - $621,000
4
Beds
3
Baths
1,660
Sq Ft
$367/Sq Ft
Est. Value
About This Home
This home is located at 12 Henry Legg Rd, Uxbridge, MA 01569 and is currently estimated at $609,280, approximately $367 per square foot. 12 Henry Legg Rd is a home located in Worcester County with nearby schools including Uxbridge High School, Our Lady of the Valley Regional School, and Whitinsville Christian School.
Ownership History
Date
Name
Owned For
Owner Type
Purchase Details
Closed on
Apr 26, 2021
Sold by
Legg Robert J
Bought by
Legg Robert J and Legg Alice V
Current Estimated Value
Home Financials for this Owner
Home Financials are based on the most recent Mortgage that was taken out on this home.
Original Mortgage
$167,500
Outstanding Balance
$138,625
Interest Rate
3%
Mortgage Type
Stand Alone Refi Refinance Of Original Loan
Estimated Equity
$470,655
Purchase Details
Closed on
Apr 29, 2013
Sold by
Legg Robert J and Legg Joanne S
Bought by
Legg Robert J
Home Financials for this Owner
Home Financials are based on the most recent Mortgage that was taken out on this home.
Original Mortgage
$192,500
Interest Rate
3.64%
Mortgage Type
New Conventional
Purchase Details
Closed on
May 22, 2000
Sold by
Est Legg Henry M and Byron-Legg Elizabeth
Bought by
Legg Robert J and Legg Joanne S
Home Financials for this Owner
Home Financials are based on the most recent Mortgage that was taken out on this home.
Original Mortgage
$130,000
Interest Rate
8.19%
Mortgage Type
Purchase Money Mortgage
Create a Home Valuation Report for This Property
The Home Valuation Report is an in-depth analysis detailing your home's value as well as a comparison with similar homes in the area
Home Values in the Area
Average Home Value in this Area
Purchase History
| Date | Buyer | Sale Price | Title Company |
|---|---|---|---|
| Legg Robert J | -- | None Available | |
| Legg Robert J | -- | None Available | |
| Legg Robert J | -- | -- | |
| Legg Robert J | -- | -- | |
| Legg Robert J | $10,000 | -- | |
| Legg Robert J | -- | -- | |
| Legg Robert J | $10,000 | -- |
Source: Public Records
Mortgage History
| Date | Status | Borrower | Loan Amount |
|---|---|---|---|
| Open | Legg Robert J | $167,500 | |
| Previous Owner | Legg Robert J | $192,500 | |
| Previous Owner | Legg Robert J | $162,000 | |
| Previous Owner | Legg Robert J | $130,000 |
Source: Public Records
Tax History Compared to Growth
Tax History
| Year | Tax Paid | Tax Assessment Tax Assessment Total Assessment is a certain percentage of the fair market value that is determined by local assessors to be the total taxable value of land and additions on the property. | Land | Improvement |
|---|---|---|---|---|
| 2025 | $72 | $547,200 | $155,400 | $391,800 |
| 2024 | $6,810 | $527,100 | $147,600 | $379,500 |
| 2023 | $6,506 | $466,400 | $127,500 | $338,900 |
| 2022 | $5,891 | $388,600 | $111,800 | $276,800 |
| 2021 | $6,148 | $388,600 | $111,800 | $276,800 |
| 2020 | $6,077 | $363,000 | $119,600 | $243,400 |
| 2019 | $6,237 | $359,500 | $131,400 | $228,100 |
| 2018 | $6,288 | $366,200 | $131,400 | $234,800 |
| 2017 | $5,666 | $334,100 | $126,100 | $208,000 |
| 2016 | $5,464 | $311,000 | $97,000 | $214,000 |
| 2015 | $5,335 | $306,600 | $97,000 | $209,600 |
Source: Public Records
Map
Nearby Homes
- 41 Pouts Ln
- 304 W River Rd
- 29 Pouts Ln Unit 29
- 46 Pouts Ln Unit 46
- 69 Pouts Ln
- 390 Hartford Ave E
- 37 Elizabeth St
- 38 William Ward St
- 46 Capron St
- 94 Carrington Ln Unit 94
- 52 Homeward Ave
- 50 Carrington Ln
- 48 Homeward Ave
- 75 Chapin St
- 14 Brown Terrace
- 19 Harvard St
- 265 Blackstone St
- 16 Pleasant St
- 440 Quaker St
- 0 Louis St