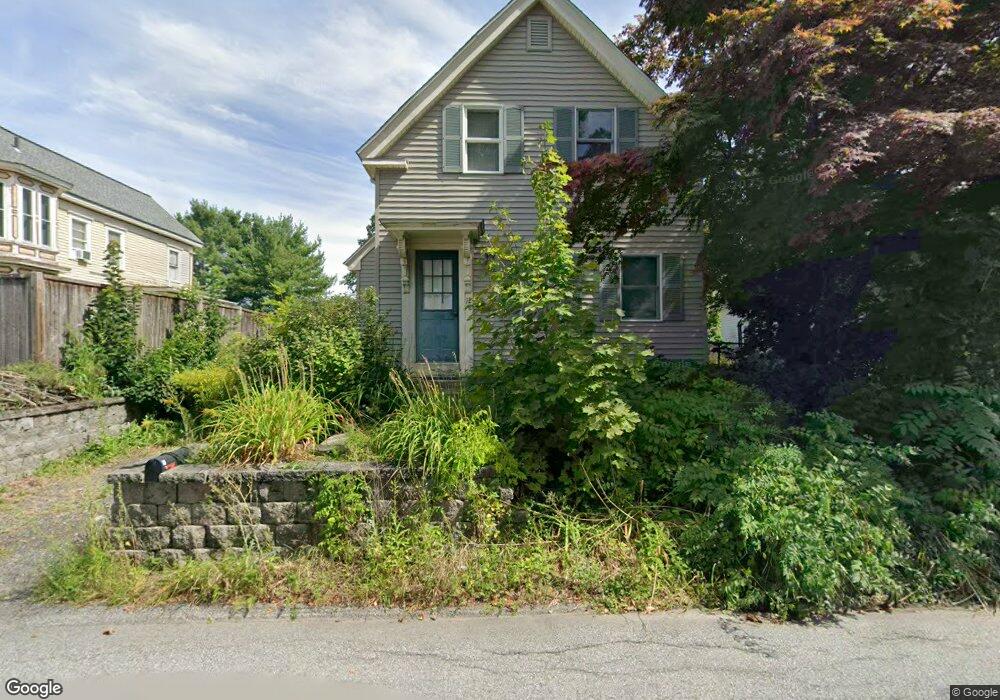
12 High St Pepperell, MA 01463
Estimated Value: $380,000 - $582,000
4
Beds
3
Baths
1,173
Sq Ft
$404/Sq Ft
Est. Value
About This Home
This home is located at 12 High St, Pepperell, MA 01463 and is currently estimated at $473,466, approximately $403 per square foot. 12 High St is a home located in Middlesex County with nearby schools including North Middlesex Regional High School, Pepperell Christian Academy, and Maple Dene & Moppet School.
Ownership History
Date
Name
Owned For
Owner Type
Purchase Details
Closed on
Apr 1, 1999
Sold by
Patenaude Albert W
Bought by
Putnam Jennifer L
Current Estimated Value
Home Financials for this Owner
Home Financials are based on the most recent Mortgage that was taken out on this home.
Original Mortgage
$121,000
Outstanding Balance
$29,977
Interest Rate
6.78%
Mortgage Type
Purchase Money Mortgage
Estimated Equity
$443,489
Purchase Details
Closed on
May 26, 1998
Sold by
King Daniel J and King Constance M
Bought by
Patenaude Albert W
Home Financials for this Owner
Home Financials are based on the most recent Mortgage that was taken out on this home.
Original Mortgage
$47,500
Interest Rate
7.03%
Mortgage Type
Purchase Money Mortgage
Create a Home Valuation Report for This Property
The Home Valuation Report is an in-depth analysis detailing your home's value as well as a comparison with similar homes in the area
Home Values in the Area
Average Home Value in this Area
Purchase History
| Date | Buyer | Sale Price | Title Company |
|---|---|---|---|
| Putnam Jennifer L | $127,500 | -- | |
| Patenaude Albert W | $47,500 | -- |
Source: Public Records
Mortgage History
| Date | Status | Borrower | Loan Amount |
|---|---|---|---|
| Open | Patenaude Albert W | $121,000 | |
| Previous Owner | Patenaude Albert W | $47,500 |
Source: Public Records
Tax History
| Year | Tax Paid | Tax Assessment Tax Assessment Total Assessment is a certain percentage of the fair market value that is determined by local assessors to be the total taxable value of land and additions on the property. | Land | Improvement |
|---|---|---|---|---|
| 2025 | $4,516 | $308,700 | $78,500 | $230,200 |
| 2024 | $4,322 | $301,200 | $71,000 | $230,200 |
| 2023 | $4,136 | $273,200 | $71,000 | $202,200 |
| 2022 | $4,003 | $233,400 | $63,500 | $169,900 |
| 2021 | $3,966 | $221,300 | $56,100 | $165,200 |
| 2020 | $3,758 | $221,300 | $56,100 | $165,200 |
| 2019 | $3,361 | $202,600 | $56,100 | $146,500 |
| 2018 | $3,058 | $186,600 | $56,100 | $130,500 |
| 2017 | $2,736 | $172,200 | $52,300 | $119,900 |
| 2016 | $2,713 | $164,100 | $52,300 | $111,800 |
| 2015 | $2,617 | $164,100 | $52,300 | $111,800 |
| 2014 | $2,547 | $160,600 | $52,300 | $108,300 |
Source: Public Records
Map
Nearby Homes
- 10 Bennett St
- 38 River Rd Unit 11
- 28-30 Groton St
- 39 Hollis St Unit A
- 29 Tarbell St
- 38 Tarbell St Unit 5B
- 38 Tarbell St Unit 1D
- 114 Groton St
- 14 Brookline St
- 33 Overlook Dr
- 208 North St
- 179 Wyman Rd
- 39 Mount Lebanon St
- 1 Nashua Rd
- 20 A Legacy Ln Unit 20A
- 24 Unkety Brook Way
- 109 Townsend St
- 120 Townsend St Unit 1
- 120 Townsend St Unit 2
- 18 Maple St Unit 14
Your Personal Tour Guide
Ask me questions while you tour the home.