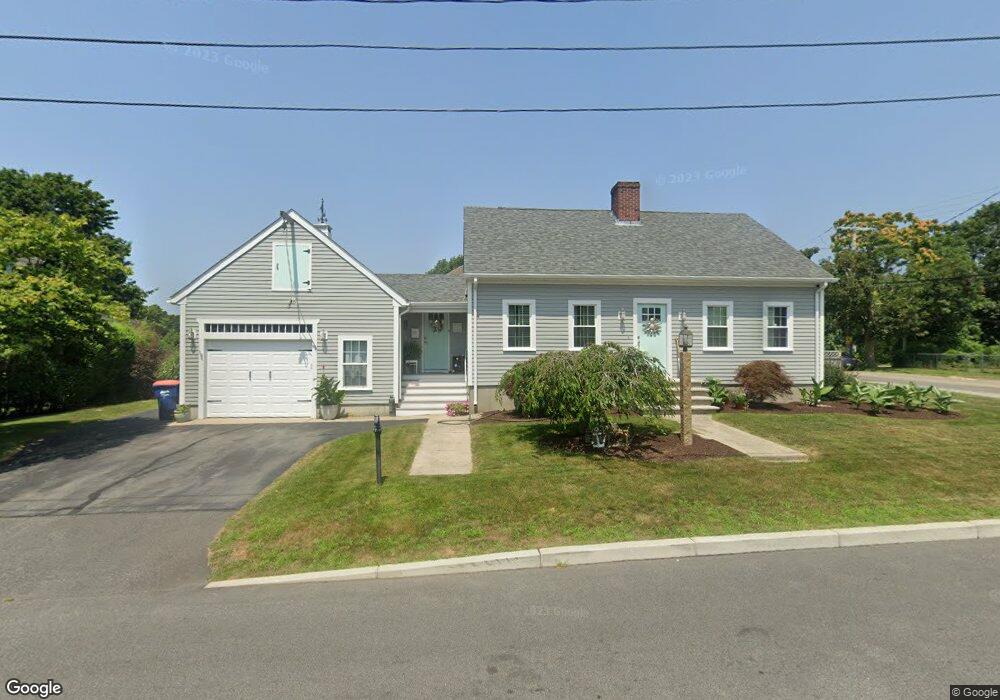
12 Hope Ave Fairhaven, MA 02719
Oxford NeighborhoodEstimated Value: $532,000 - $560,000
3
Beds
2
Baths
1,571
Sq Ft
$346/Sq Ft
Est. Value
About This Home
This home is located at 12 Hope Ave, Fairhaven, MA 02719 and is currently estimated at $542,843, approximately $345 per square foot. 12 Hope Ave is a home located in Bristol County with nearby schools including Fairhaven High School, City On A Hill Charter Public School New Bedford, and St. Joseph School.
Ownership History
Date
Name
Owned For
Owner Type
Purchase Details
Closed on
Sep 29, 2021
Sold by
Horn Joyce A
Bought by
Joyce A Horn Ret
Current Estimated Value
Purchase Details
Closed on
Nov 15, 1995
Sold by
Smith Michael and Smith Janice
Bought by
Horn Russell D and Horn Joyce S
Home Financials for this Owner
Home Financials are based on the most recent Mortgage that was taken out on this home.
Original Mortgage
$75,000
Interest Rate
7.53%
Mortgage Type
Purchase Money Mortgage
Create a Home Valuation Report for This Property
The Home Valuation Report is an in-depth analysis detailing your home's value as well as a comparison with similar homes in the area
Home Values in the Area
Average Home Value in this Area
Purchase History
| Date | Buyer | Sale Price | Title Company |
|---|---|---|---|
| Joyce A Horn Ret | -- | None Available | |
| Horn Russell D | $105,000 | -- |
Source: Public Records
Mortgage History
| Date | Status | Borrower | Loan Amount |
|---|---|---|---|
| Previous Owner | Horn Russell D | $217,000 | |
| Previous Owner | Horn Russell D | $130,000 | |
| Previous Owner | Horn Russell D | $75,000 |
Source: Public Records
Tax History Compared to Growth
Tax History
| Year | Tax Paid | Tax Assessment Tax Assessment Total Assessment is a certain percentage of the fair market value that is determined by local assessors to be the total taxable value of land and additions on the property. | Land | Improvement |
|---|---|---|---|---|
| 2025 | $41 | $439,700 | $174,000 | $265,700 |
| 2024 | $4,028 | $436,400 | $174,000 | $262,400 |
| 2023 | $3,734 | $375,300 | $152,400 | $222,900 |
| 2022 | $3,633 | $355,500 | $141,600 | $213,900 |
| 2021 | $3,713 | $328,900 | $128,100 | $200,800 |
| 2020 | $3,557 | $321,600 | $128,100 | $193,500 |
| 2019 | $3,413 | $292,500 | $106,300 | $186,200 |
| 2018 | $3,275 | $278,700 | $101,100 | $177,600 |
| 2017 | $3,215 | $267,000 | $101,100 | $165,900 |
| 2016 | $3,207 | $263,300 | $101,100 | $162,200 |
| 2015 | $3,044 | $250,500 | $101,100 | $149,400 |
Source: Public Records
Map
Nearby Homes