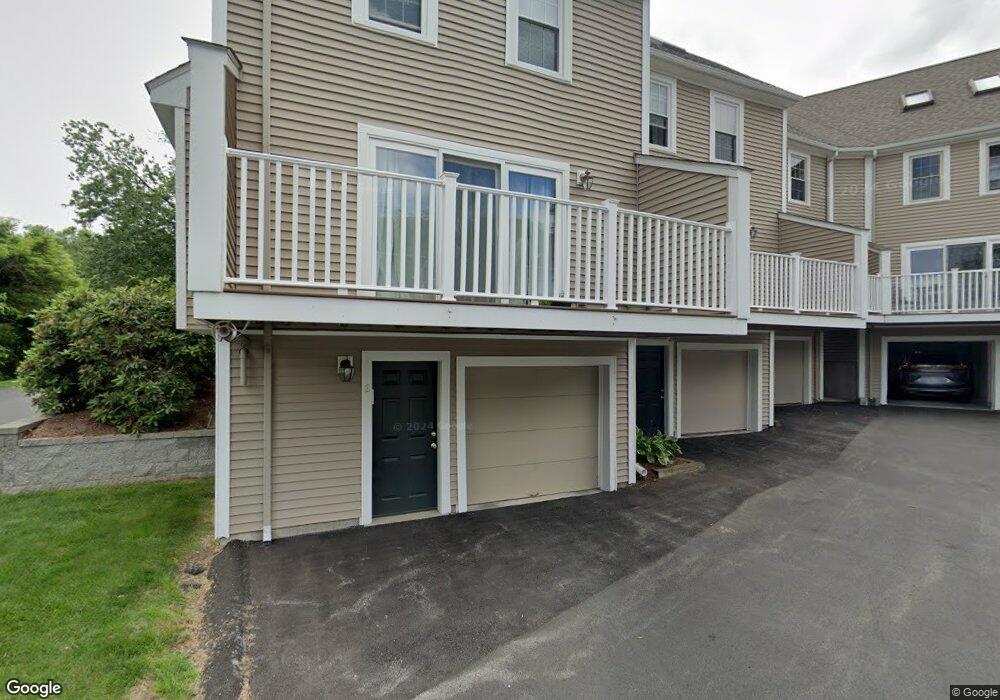
12 Hovey Pond Dr North Grafton, MA 01536
Estimated Value: $405,422 - $460,000
3
Beds
2
Baths
1,350
Sq Ft
$313/Sq Ft
Est. Value
About This Home
This home is located at 12 Hovey Pond Dr, North Grafton, MA 01536 and is currently estimated at $422,856, approximately $313 per square foot. 12 Hovey Pond Dr is a home located in Worcester County with nearby schools including Grafton High School, Silver Spruce Montessori School, and Al-Hamra Academy.
Ownership History
Date
Name
Owned For
Owner Type
Purchase Details
Closed on
Oct 31, 2012
Sold by
Kourey Chris R
Bought by
Burra Giridhar and Chikkam Shyamala
Current Estimated Value
Home Financials for this Owner
Home Financials are based on the most recent Mortgage that was taken out on this home.
Original Mortgage
$116,250
Outstanding Balance
$80,748
Interest Rate
3.5%
Mortgage Type
New Conventional
Estimated Equity
$342,108
Purchase Details
Closed on
Feb 28, 2002
Sold by
Zullo Edward M
Bought by
Kourey Chris R
Home Financials for this Owner
Home Financials are based on the most recent Mortgage that was taken out on this home.
Original Mortgage
$153,600
Interest Rate
6.85%
Mortgage Type
Purchase Money Mortgage
Purchase Details
Closed on
Sep 14, 1993
Sold by
Mcquarrie William G
Bought by
Zullo Edward M
Home Financials for this Owner
Home Financials are based on the most recent Mortgage that was taken out on this home.
Original Mortgage
$54,450
Interest Rate
7.21%
Mortgage Type
Purchase Money Mortgage
Create a Home Valuation Report for This Property
The Home Valuation Report is an in-depth analysis detailing your home's value as well as a comparison with similar homes in the area
Home Values in the Area
Average Home Value in this Area
Purchase History
| Date | Buyer | Sale Price | Title Company |
|---|---|---|---|
| Burra Giridhar | $155,000 | -- | |
| Kourey Chris R | $192,000 | -- | |
| Zullo Edward M | $99,000 | -- |
Source: Public Records
Mortgage History
| Date | Status | Borrower | Loan Amount |
|---|---|---|---|
| Open | Burra Giridhar | $116,250 | |
| Previous Owner | Zullo Edward M | $67,200 | |
| Previous Owner | Zullo Edward M | $153,600 | |
| Previous Owner | Zullo Edward M | $28,800 | |
| Previous Owner | Zullo Edward M | $54,450 |
Source: Public Records
Tax History Compared to Growth
Tax History
| Year | Tax Paid | Tax Assessment Tax Assessment Total Assessment is a certain percentage of the fair market value that is determined by local assessors to be the total taxable value of land and additions on the property. | Land | Improvement |
|---|---|---|---|---|
| 2025 | $4,762 | $341,600 | $0 | $341,600 |
| 2024 | $4,415 | $308,500 | $0 | $308,500 |
| 2023 | $4,229 | $269,200 | $0 | $269,200 |
| 2022 | $4,034 | $239,000 | $0 | $239,000 |
| 2021 | $4,063 | $236,500 | $0 | $236,500 |
| 2020 | $3,643 | $220,800 | $0 | $220,800 |
| 2019 | $3,730 | $223,900 | $0 | $223,900 |
| 2018 | $3,414 | $205,800 | $0 | $205,800 |
| 2017 | $3,291 | $200,700 | $0 | $200,700 |
| 2016 | $2,672 | $159,500 | $0 | $159,500 |
| 2015 | $2,817 | $170,700 | $0 | $170,700 |
| 2014 | $2,605 | $170,700 | $0 | $170,700 |
Source: Public Records
Map
Nearby Homes
- 11 Hovey Pond Dr Unit 11
- 194 Worcester St
- 14 Northgate Ct Unit 14
- 17 Hingham Rd
- 30 Falmouth Dr
- 4 Westboro Rd
- 44 Meadow Ln
- 0 East St
- 76 Samuel Dr
- 15 Windle Ave
- 21 Lordvale Blvd Unit 406
- 69 Cortland Grove Dr Unit 69
- 5 Lincoln Ln Unit 5
- 4 Winslow Ln Unit 1410
- 3 Abby Rd
- 51 Cortland Grove Dr Unit 51
- 28 Lincoln Ln
- 46 John Dr Unit 46
- 5 Edward Dr
- 39 Pointe Rok Dr Unit 39
- 24 Hovey Pond Dr
- 12 Hovey Pond Dr Unit 12
- 24 Hovey Pond Dr Unit 24
- 20 Hovey Pond Dr
- 16 Hovey Pond Dr
- 14 Hovey Pond Dr
- 8 Hovey Pond Dr
- 6 Hovey Pond Dr
- 6 Hovey Pond Dr Unit 203
- 16 Hovey Pond Dr Unit 16
- 22 Hovey Pond Dr
- 18 Hovey Pond Dr
- 10 Hovey Pond Dr
- 4 Hovey Pond Dr
- 2 Hovey Pond Dr
- 22 Hovey Pond Dr Unit 22
- 22 Hovey Pond Dr Unit 22 2
- 10 Hovey Pond Dr Unit 10
- 2 Hovey Pond Dr Unit 2
- 18 Hovey Pond Dr Unit 18