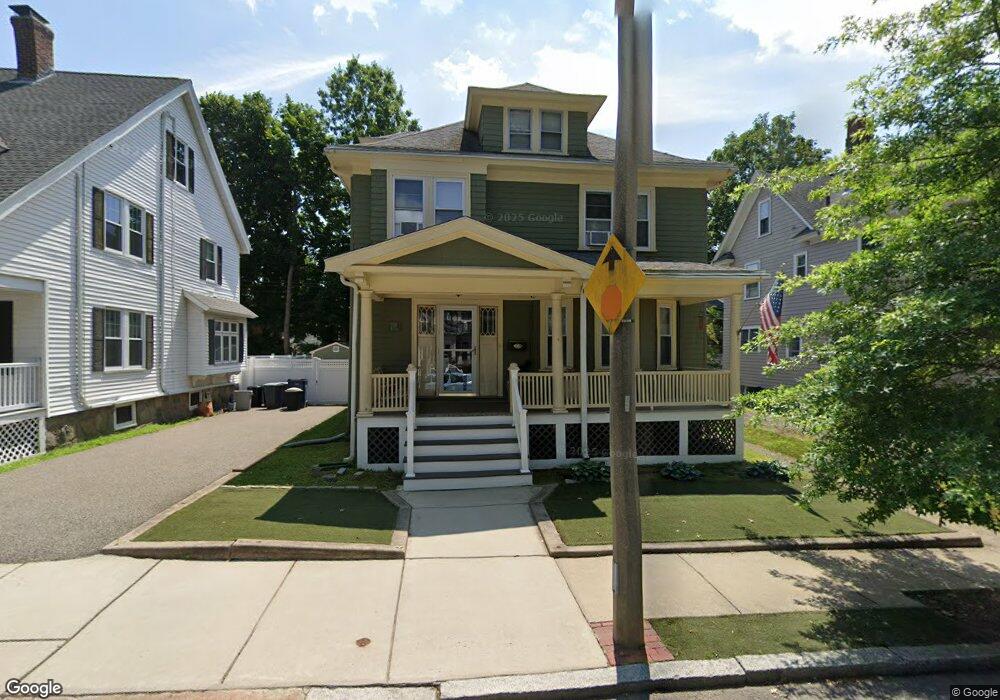
12 Howitt Rd West Roxbury, MA 02132
Bellevue Hill NeighborhoodEstimated Value: $869,465 - $1,129,000
4
Beds
2
Baths
1,732
Sq Ft
$610/Sq Ft
Est. Value
About This Home
This home is located at 12 Howitt Rd, West Roxbury, MA 02132 and is currently estimated at $1,057,116, approximately $610 per square foot. 12 Howitt Rd is a home located in Suffolk County with nearby schools including St Theresa School, Holy Name Parish School, and The Roxbury Latin School.
Ownership History
Date
Name
Owned For
Owner Type
Purchase Details
Closed on
Apr 1, 2004
Sold by
Cherry Ann T
Bought by
Temple Kenneth T and Temple Sheila C
Current Estimated Value
Purchase Details
Closed on
Oct 1, 2002
Sold by
Lenzana Guido
Bought by
Sanborn Gregg M and Sanborn Laura D
Create a Home Valuation Report for This Property
The Home Valuation Report is an in-depth analysis detailing your home's value as well as a comparison with similar homes in the area
Home Values in the Area
Average Home Value in this Area
Purchase History
| Date | Buyer | Sale Price | Title Company |
|---|---|---|---|
| Temple Kenneth T | $500,000 | -- | |
| Sanborn Gregg M | $455,000 | -- |
Source: Public Records
Mortgage History
| Date | Status | Borrower | Loan Amount |
|---|---|---|---|
| Open | Sanborn Gregg M | $473,417 | |
| Closed | Sanborn Gregg M | $469,762 | |
| Closed | Sanborn Gregg M | $100,000 |
Source: Public Records
Tax History
| Year | Tax Paid | Tax Assessment Tax Assessment Total Assessment is a certain percentage of the fair market value that is determined by local assessors to be the total taxable value of land and additions on the property. | Land | Improvement |
|---|---|---|---|---|
| 2025 | $9,003 | $777,500 | $281,300 | $496,200 |
| 2024 | $7,519 | $689,800 | $266,300 | $423,500 |
| 2023 | $6,989 | $650,700 | $251,200 | $399,500 |
| 2022 | $6,437 | $591,600 | $228,400 | $363,200 |
| 2021 | $6,011 | $563,400 | $221,700 | $341,700 |
| 2020 | $5,816 | $550,800 | $204,900 | $345,900 |
| 2019 | $5,410 | $513,300 | $173,200 | $340,100 |
| 2018 | $5,122 | $488,700 | $173,200 | $315,500 |
| 2017 | $5,122 | $483,700 | $173,200 | $310,500 |
| 2016 | $5,019 | $456,300 | $173,200 | $283,100 |
| 2015 | $5,074 | $419,000 | $149,000 | $270,000 |
| 2014 | $4,921 | $391,200 | $149,000 | $242,200 |
Source: Public Records
Map
Nearby Homes
- 73 Woodard Rd
- 78 Howitt Rd
- 205 Park St Unit 2
- 348 Lagrange St
- 37 Pelton St
- 425 Lagrange St Unit 203
- 17 Hastings St Unit 5
- 4 Anawan Ave Unit 7
- 35 Heron St
- 2231 Centre St
- 17 Starling St
- 16 Starling St
- 24 Rhoda St
- 1721 Centre St Unit 402
- 37 Hastings St Unit 201
- 83 Newburg St Unit 1
- 14 Heron St Unit 14-207
- 14 Heron St Unit 210
- 150 Tyndale St Unit 2
- 4925 Washington St Unit 201
Your Personal Tour Guide
Ask me questions while you tour the home.