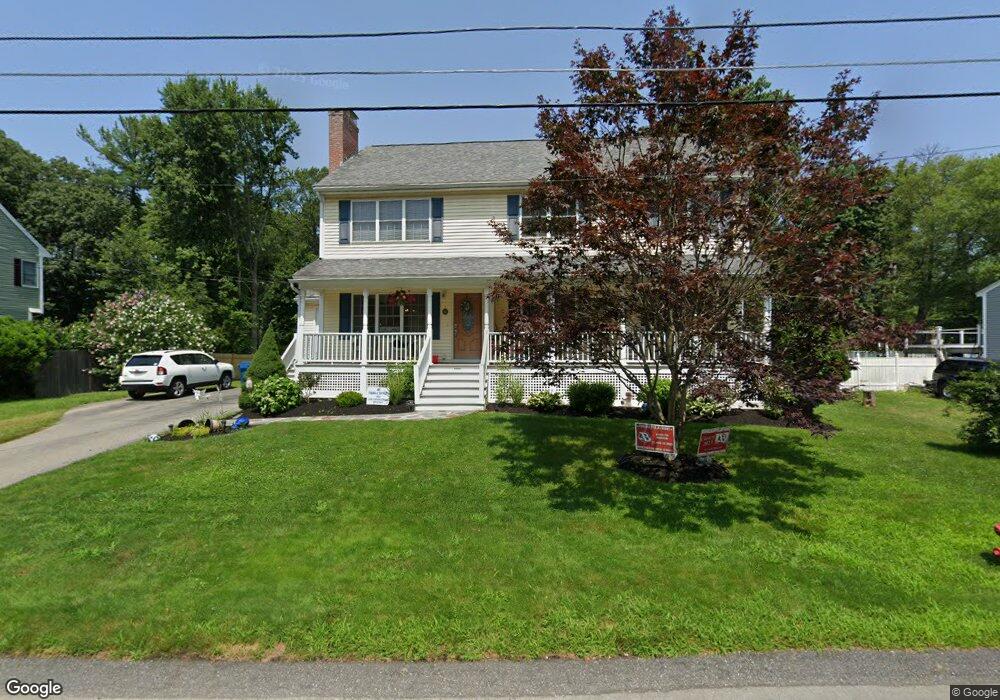
12 Irene St Burlington, MA 01803
North Burlington NeighborhoodEstimated Value: $750,000 - $1,111,000
4
Beds
4
Baths
2,320
Sq Ft
$411/Sq Ft
Est. Value
About This Home
This home is located at 12 Irene St, Burlington, MA 01803 and is currently estimated at $953,768, approximately $411 per square foot. 12 Irene St is a home located in Middlesex County with nearby schools including Burlington High School, Fox Hill, and Marshall Simonds Middle School.
Ownership History
Date
Name
Owned For
Owner Type
Purchase Details
Closed on
Apr 5, 2005
Sold by
Browne Thomas
Bought by
Browne Michelle and Browne Thomas
Current Estimated Value
Home Financials for this Owner
Home Financials are based on the most recent Mortgage that was taken out on this home.
Original Mortgage
$380,000
Interest Rate
5.61%
Mortgage Type
Purchase Money Mortgage
Purchase Details
Closed on
Oct 2, 2002
Sold by
Miller Randall H
Bought by
Browne Thomas
Home Financials for this Owner
Home Financials are based on the most recent Mortgage that was taken out on this home.
Original Mortgage
$280,000
Interest Rate
6.27%
Mortgage Type
Purchase Money Mortgage
Purchase Details
Closed on
Apr 24, 1998
Sold by
Ryan John P and Ryan Gail P
Bought by
Miller Randall H
Purchase Details
Closed on
Aug 1, 1989
Sold by
Kemper Wayne H
Bought by
Ryan John P
Create a Home Valuation Report for This Property
The Home Valuation Report is an in-depth analysis detailing your home's value as well as a comparison with similar homes in the area
Home Values in the Area
Average Home Value in this Area
Purchase History
| Date | Buyer | Sale Price | Title Company |
|---|---|---|---|
| Browne Michelle | -- | -- | |
| Browne Thomas | $350,000 | -- | |
| Miller Randall H | $219,900 | -- | |
| Miller Randall H | $219,900 | -- | |
| Ryan John P | $183,000 | -- | |
| Ryan John P | $183,000 | -- |
Source: Public Records
Mortgage History
| Date | Status | Borrower | Loan Amount |
|---|---|---|---|
| Open | Ryan John P | $355,000 | |
| Closed | Browne Michelle | $380,000 | |
| Previous Owner | Browne Thomas | $280,000 |
Source: Public Records
Tax History Compared to Growth
Tax History
| Year | Tax Paid | Tax Assessment Tax Assessment Total Assessment is a certain percentage of the fair market value that is determined by local assessors to be the total taxable value of land and additions on the property. | Land | Improvement |
|---|---|---|---|---|
| 2025 | $7,127 | $823,000 | $403,800 | $419,200 |
| 2024 | $6,973 | $780,000 | $382,900 | $397,100 |
| 2023 | $6,753 | $718,400 | $332,500 | $385,900 |
| 2022 | $6,489 | $652,200 | $303,100 | $349,100 |
| 2021 | $11,730 | $624,600 | $275,500 | $349,100 |
| 2020 | $6,030 | $625,500 | $275,500 | $350,000 |
| 2019 | $5,866 | $559,700 | $257,500 | $302,200 |
| 2018 | $10,757 | $547,300 | $245,100 | $302,200 |
| 2017 | $12,882 | $547,300 | $245,100 | $302,200 |
| 2016 | $5,488 | $478,900 | $209,000 | $269,900 |
| 2015 | $5,436 | $478,900 | $209,000 | $269,900 |
| 2014 | $5,446 | $453,800 | $190,000 | $263,800 |
Source: Public Records
Map
Nearby Homes