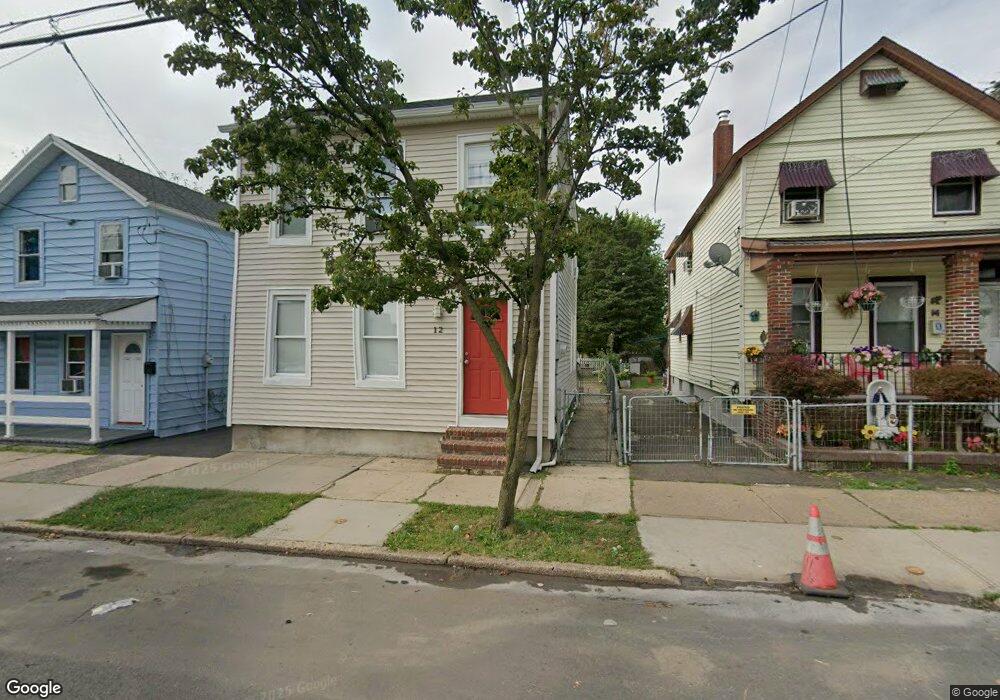
12 James St New Brunswick, NJ 08901
Estimated Value: $318,000 - $421,000
--
Bed
--
Bath
1,601
Sq Ft
$237/Sq Ft
Est. Value
About This Home
This home is located at 12 James St, New Brunswick, NJ 08901 and is currently estimated at $379,850, approximately $237 per square foot. 12 James St is a home located in Middlesex County with nearby schools including New Brunswick High School and Central Jersey College Prep Charter School.
Ownership History
Date
Name
Owned For
Owner Type
Purchase Details
Closed on
Oct 10, 2019
Sold by
Baxter Matthew
Bought by
Bekus Homes Llc
Current Estimated Value
Home Financials for this Owner
Home Financials are based on the most recent Mortgage that was taken out on this home.
Original Mortgage
$140,000
Interest Rate
3.7%
Mortgage Type
Purchase Money Mortgage
Purchase Details
Closed on
Sep 10, 2004
Sold by
Gardner Donald
Bought by
Baxter Matthew
Home Financials for this Owner
Home Financials are based on the most recent Mortgage that was taken out on this home.
Original Mortgage
$168,000
Interest Rate
5.89%
Create a Home Valuation Report for This Property
The Home Valuation Report is an in-depth analysis detailing your home's value as well as a comparison with similar homes in the area
Home Values in the Area
Average Home Value in this Area
Purchase History
| Date | Buyer | Sale Price | Title Company |
|---|---|---|---|
| Bekus Homes Llc | $170,000 | Simplicity Title Llc | |
| Baxter Matthew | $210,000 | -- |
Source: Public Records
Mortgage History
| Date | Status | Borrower | Loan Amount |
|---|---|---|---|
| Closed | Bekus Homes Llc | $140,000 | |
| Previous Owner | Baxter Matthew | $168,000 |
Source: Public Records
Tax History Compared to Growth
Tax History
| Year | Tax Paid | Tax Assessment Tax Assessment Total Assessment is a certain percentage of the fair market value that is determined by local assessors to be the total taxable value of land and additions on the property. | Land | Improvement |
|---|---|---|---|---|
| 2025 | $5,440 | $207,700 | $80,000 | $127,700 |
| 2024 | $5,282 | $207,700 | $80,000 | $127,700 |
| 2023 | $5,282 | $207,700 | $80,000 | $127,700 |
| 2022 | $5,170 | $207,700 | $80,000 | $127,700 |
| 2021 | $3,835 | $207,700 | $80,000 | $127,700 |
| 2020 | $5,130 | $207,700 | $80,000 | $127,700 |
| 2019 | $5,033 | $207,700 | $80,000 | $127,700 |
| 2018 | $4,918 | $207,700 | $80,000 | $127,700 |
| 2017 | $4,723 | $207,700 | $80,000 | $127,700 |
| 2016 | $5,326 | $90,800 | $25,000 | $65,800 |
| 2015 | $5,199 | $90,800 | $25,000 | $65,800 |
| 2014 | $5,107 | $90,800 | $25,000 | $65,800 |
Source: Public Records
Map
Nearby Homes