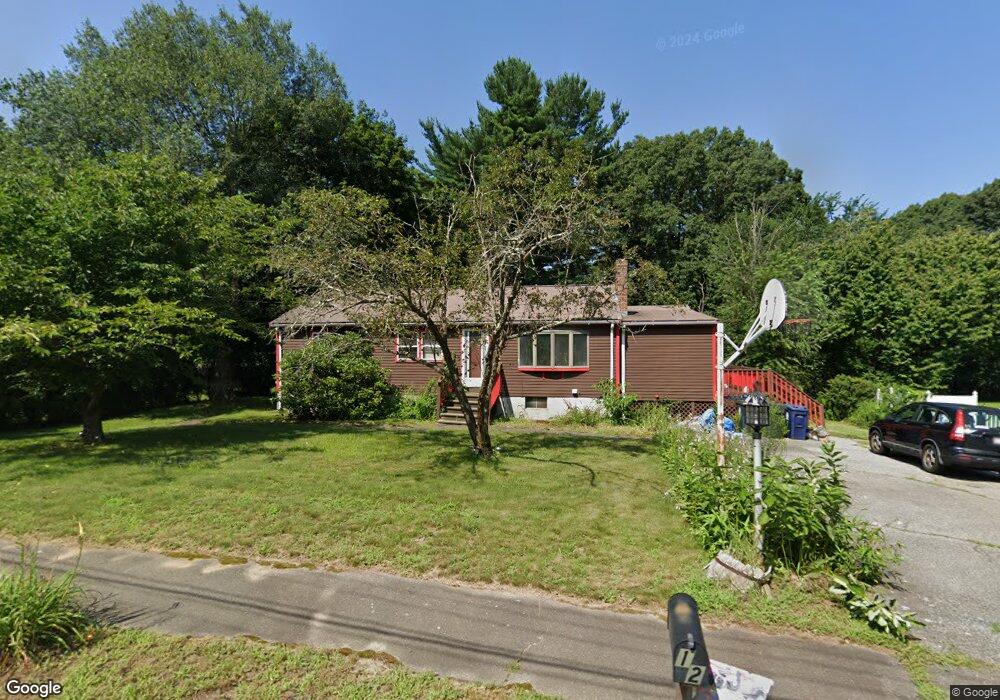
12 Jere Rd Wilmington, MA 01887
Estimated Value: $698,758 - $780,000
3
Beds
2
Baths
1,188
Sq Ft
$617/Sq Ft
Est. Value
About This Home
This home is located at 12 Jere Rd, Wilmington, MA 01887 and is currently estimated at $733,440, approximately $617 per square foot. 12 Jere Rd is a home located in Middlesex County with nearby schools including Wilmington Middle School and Wilmington High School.
Ownership History
Date
Name
Owned For
Owner Type
Purchase Details
Closed on
Jul 29, 2019
Sold by
Maynard Robert K and Robbers Roberta M
Bought by
Maynard-Robbers Ft 2019
Current Estimated Value
Purchase Details
Closed on
Aug 21, 1991
Sold by
Goulet Paul G and Goulet Joan
Bought by
Maynard Robert K and Robbers Roberta
Create a Home Valuation Report for This Property
The Home Valuation Report is an in-depth analysis detailing your home's value as well as a comparison with similar homes in the area
Home Values in the Area
Average Home Value in this Area
Purchase History
| Date | Buyer | Sale Price | Title Company |
|---|---|---|---|
| Maynard-Robbers Ft 2019 | -- | -- | |
| Maynard Robert K | $169,000 | -- |
Source: Public Records
Mortgage History
| Date | Status | Borrower | Loan Amount |
|---|---|---|---|
| Previous Owner | Maynard Robert K | $205,000 | |
| Previous Owner | Maynard Robert K | $50,000 |
Source: Public Records
Tax History Compared to Growth
Tax History
| Year | Tax Paid | Tax Assessment Tax Assessment Total Assessment is a certain percentage of the fair market value that is determined by local assessors to be the total taxable value of land and additions on the property. | Land | Improvement |
|---|---|---|---|---|
| 2025 | $7,414 | $647,500 | $359,500 | $288,000 |
| 2024 | $7,146 | $625,200 | $359,500 | $265,700 |
| 2023 | $6,918 | $579,400 | $326,900 | $252,500 |
| 2022 | $6,554 | $503,000 | $272,800 | $230,200 |
| 2021 | $6,553 | $473,500 | $248,400 | $225,100 |
| 2020 | $6,292 | $463,300 | $248,400 | $214,900 |
| 2019 | $6,230 | $453,100 | $236,500 | $216,600 |
| 2018 | $6,031 | $418,500 | $225,300 | $193,200 |
| 2017 | $5,848 | $404,700 | $225,300 | $179,400 |
| 2016 | $5,603 | $383,000 | $214,600 | $168,400 |
| 2015 | $5,305 | $369,200 | $214,600 | $154,600 |
| 2014 | $5,025 | $352,900 | $204,600 | $148,300 |
Source: Public Records
Map
Nearby Homes