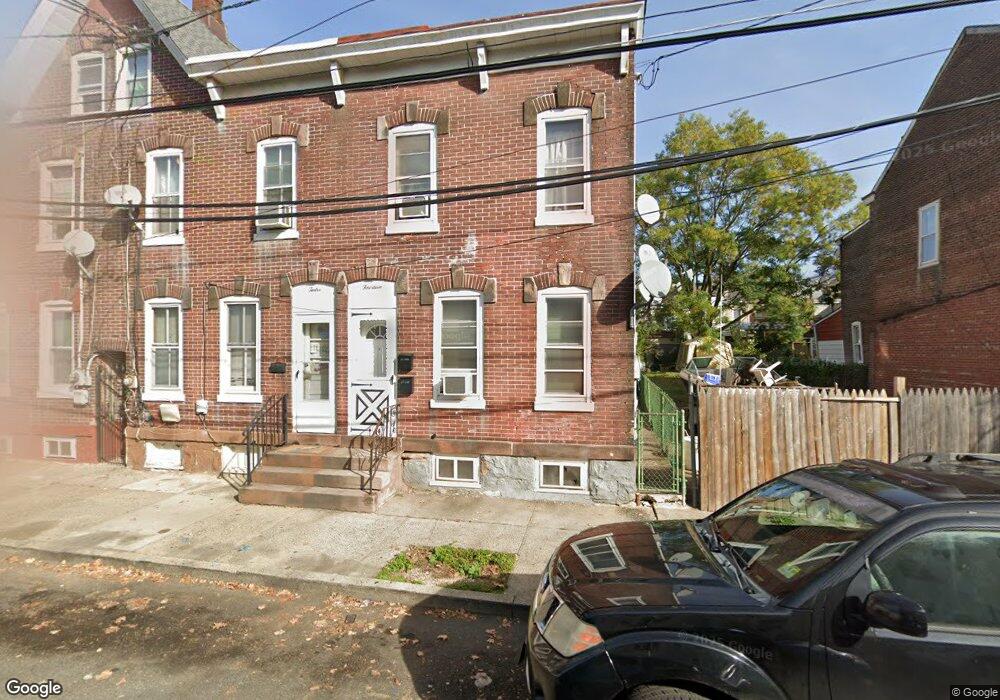
12 Jersey St Trenton, NJ 08611
South Trenton NeighborhoodEstimated Value: $143,403 - $212,000
--
Bed
--
Bath
1,472
Sq Ft
$120/Sq Ft
Est. Value
About This Home
This home is located at 12 Jersey St, Trenton, NJ 08611 and is currently estimated at $176,101, approximately $119 per square foot. 12 Jersey St is a home located in Mercer County with nearby schools including Mott Elementary School, Parker Elementary School, and Dr. Crosby Copeland Elementary School.
Ownership History
Date
Name
Owned For
Owner Type
Purchase Details
Closed on
May 12, 2000
Sold by
Lancaster Joel
Bought by
Carcione Mark
Current Estimated Value
Home Financials for this Owner
Home Financials are based on the most recent Mortgage that was taken out on this home.
Original Mortgage
$54,000
Outstanding Balance
$18,602
Interest Rate
8.1%
Estimated Equity
$157,499
Purchase Details
Closed on
Apr 4, 2000
Sold by
Bramble Veronica
Bought by
Lancaster Joel
Home Financials for this Owner
Home Financials are based on the most recent Mortgage that was taken out on this home.
Original Mortgage
$54,000
Outstanding Balance
$18,602
Interest Rate
8.1%
Estimated Equity
$157,499
Create a Home Valuation Report for This Property
The Home Valuation Report is an in-depth analysis detailing your home's value as well as a comparison with similar homes in the area
Home Values in the Area
Average Home Value in this Area
Purchase History
| Date | Buyer | Sale Price | Title Company |
|---|---|---|---|
| Carcione Mark | $60,000 | -- | |
| Lancaster Joel | $25,000 | -- |
Source: Public Records
Mortgage History
| Date | Status | Borrower | Loan Amount |
|---|---|---|---|
| Open | Carcione Mark | $54,000 |
Source: Public Records
Tax History Compared to Growth
Tax History
| Year | Tax Paid | Tax Assessment Tax Assessment Total Assessment is a certain percentage of the fair market value that is determined by local assessors to be the total taxable value of land and additions on the property. | Land | Improvement |
|---|---|---|---|---|
| 2025 | $2,222 | $38,300 | $8,500 | $29,800 |
| 2024 | $2,132 | $38,300 | $8,500 | $29,800 |
| 2023 | $2,132 | $38,300 | $8,500 | $29,800 |
| 2022 | $2,090 | $38,300 | $8,500 | $29,800 |
| 2021 | $2,127 | $38,300 | $8,500 | $29,800 |
| 2020 | $2,120 | $38,300 | $8,500 | $29,800 |
| 2019 | $2,086 | $38,300 | $8,500 | $29,800 |
| 2018 | $1,997 | $38,300 | $8,500 | $29,800 |
| 2017 | $1,898 | $38,300 | $8,500 | $29,800 |
| 2016 | $3,567 | $62,000 | $15,100 | $46,900 |
| 2015 | $3,554 | $62,000 | $15,100 | $46,900 |
| 2014 | $3,538 | $62,000 | $15,100 | $46,900 |
Source: Public Records
Map
Nearby Homes