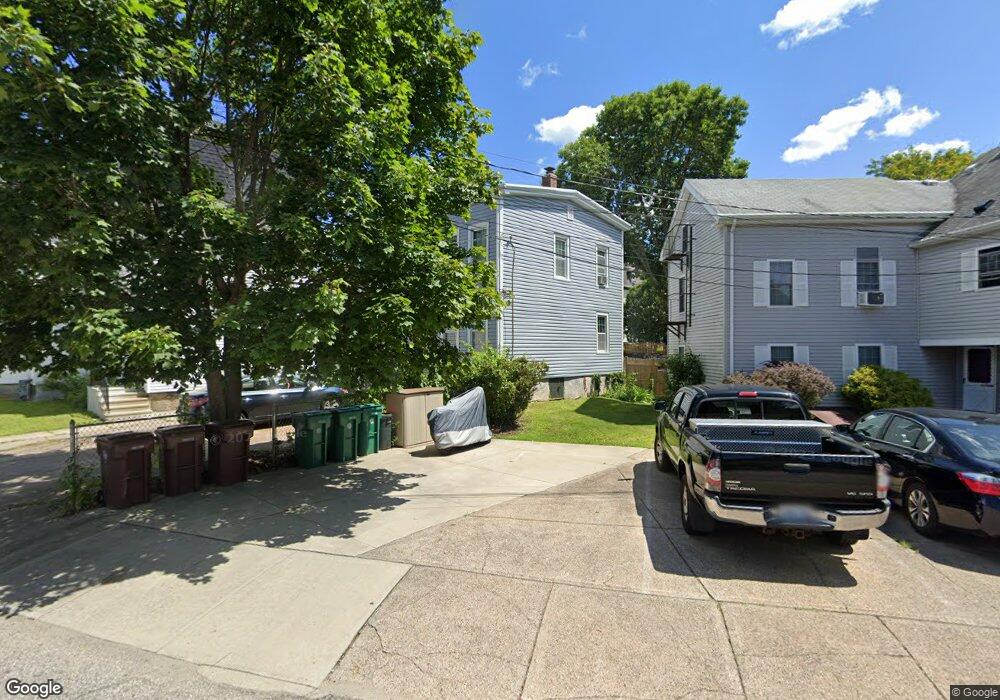
12 John St Woonsocket, RI 02895
Constitution Hill NeighborhoodEstimated Value: $336,273 - $427,000
4
Beds
2
Baths
1,636
Sq Ft
$241/Sq Ft
Est. Value
About This Home
This home is located at 12 John St, Woonsocket, RI 02895 and is currently estimated at $394,068, approximately $240 per square foot. 12 John St is a home located in Providence County with nearby schools including Woonsocket High School, Founders Academy, and Beacon Charter School.
Ownership History
Date
Name
Owned For
Owner Type
Purchase Details
Closed on
Sep 11, 2003
Sold by
Jackson Johnsie P
Bought by
Lespinasse Asly
Current Estimated Value
Home Financials for this Owner
Home Financials are based on the most recent Mortgage that was taken out on this home.
Original Mortgage
$106,700
Outstanding Balance
$48,631
Interest Rate
6.22%
Mortgage Type
Purchase Money Mortgage
Estimated Equity
$345,437
Create a Home Valuation Report for This Property
The Home Valuation Report is an in-depth analysis detailing your home's value as well as a comparison with similar homes in the area
Home Values in the Area
Average Home Value in this Area
Purchase History
| Date | Buyer | Sale Price | Title Company |
|---|---|---|---|
| Lespinasse Asly | $110,000 | -- | |
| Lespinasse Asly | $110,000 | -- |
Source: Public Records
Mortgage History
| Date | Status | Borrower | Loan Amount |
|---|---|---|---|
| Open | Lespinasse Asly | $106,700 | |
| Closed | Lespinasse Asly | $106,700 |
Source: Public Records
Tax History
| Year | Tax Paid | Tax Assessment Tax Assessment Total Assessment is a certain percentage of the fair market value that is determined by local assessors to be the total taxable value of land and additions on the property. | Land | Improvement |
|---|---|---|---|---|
| 2025 | $3,302 | $294,000 | $46,400 | $247,600 |
| 2024 | $2,909 | $200,100 | $49,100 | $151,000 |
| 2023 | $2,797 | $200,100 | $49,100 | $151,000 |
| 2022 | $2,797 | $200,100 | $49,100 | $151,000 |
| 2021 | $2,126 | $89,500 | $22,800 | $66,700 |
| 2020 | $2,148 | $89,500 | $22,800 | $66,700 |
| 2018 | $2,011 | $83,500 | $22,800 | $60,700 |
| 2017 | $2,363 | $78,500 | $31,000 | $47,500 |
| 2016 | $2,499 | $78,500 | $31,000 | $47,500 |
| 2015 | $2,872 | $78,500 | $31,000 | $47,500 |
| 2014 | $2,558 | $78,200 | $34,100 | $44,100 |
Source: Public Records
Map
Nearby Homes
- 0 Holbrook Ln Unit 1402850
- 435 S Main St
- 80 Summit St
- 190 Coe St
- 83 4th Ave
- 43 Summit St
- 168 3rd Ave
- 123 4th Ave
- 379 Front St
- 36 Fairmount St
- 122 Grand St
- 99 Allen St Unit 205
- 184 Avenue C Unit 2
- 184 Avenue C Unit 5
- 184 Avenue C Unit 6
- 184 Avenue C Unit 3
- 184 Avenue C Unit 4
- 184 Avenue C Unit 1
- 84 Bernice Ave
- 92 Rockland Ave
Your Personal Tour Guide
Ask me questions while you tour the home.