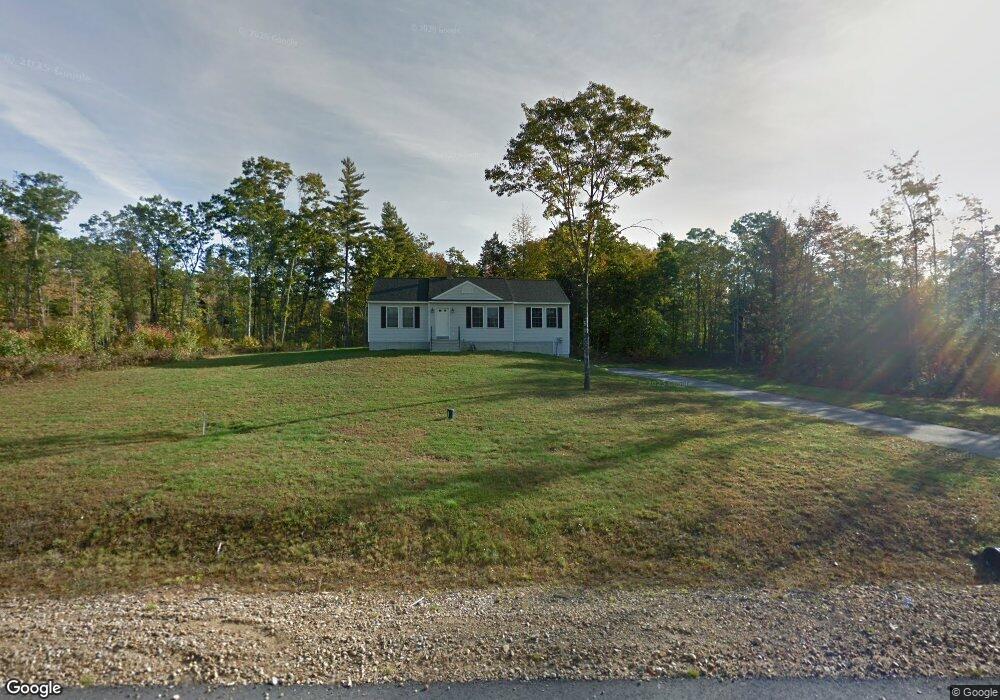
12 Johnnie Ln Berwick, ME 03901
Estimated Value: $486,000 - $538,000
2
Beds
1
Bath
832
Sq Ft
$607/Sq Ft
Est. Value
About This Home
This home is located at 12 Johnnie Ln, Berwick, ME 03901 and is currently estimated at $504,670, approximately $606 per square foot. 12 Johnnie Ln is a home located in York County with nearby schools including Noble High School.
Ownership History
Date
Name
Owned For
Owner Type
Purchase Details
Closed on
Apr 8, 2020
Sold by
Roberts Morgan S and Roberts Robin S
Bought by
Gardner William E and Gardner Haley R
Current Estimated Value
Home Financials for this Owner
Home Financials are based on the most recent Mortgage that was taken out on this home.
Original Mortgage
$304,385
Outstanding Balance
$266,702
Interest Rate
3.4%
Mortgage Type
FHA
Estimated Equity
$237,968
Purchase Details
Closed on
May 15, 2018
Sold by
Gilb John C and Gilb Jullianne N
Bought by
Roberts Robin S and Montville Morgan S
Home Financials for this Owner
Home Financials are based on the most recent Mortgage that was taken out on this home.
Original Mortgage
$250,000
Interest Rate
4.44%
Mortgage Type
New Conventional
Purchase Details
Closed on
Dec 16, 2009
Sold by
T C Corliss Constr Llc
Bought by
Gilb John C and Gilb Jullianne N
Home Financials for this Owner
Home Financials are based on the most recent Mortgage that was taken out on this home.
Original Mortgage
$237,550
Interest Rate
5%
Mortgage Type
FHA
Create a Home Valuation Report for This Property
The Home Valuation Report is an in-depth analysis detailing your home's value as well as a comparison with similar homes in the area
Home Values in the Area
Average Home Value in this Area
Purchase History
| Date | Buyer | Sale Price | Title Company |
|---|---|---|---|
| Gardner William E | -- | None Available | |
| Roberts Robin S | -- | -- | |
| Gilb John C | -- | -- |
Source: Public Records
Mortgage History
| Date | Status | Borrower | Loan Amount |
|---|---|---|---|
| Open | Gardner William E | $304,385 | |
| Previous Owner | Roberts Robin S | $250,000 | |
| Previous Owner | Gilb John C | $238,150 | |
| Previous Owner | Gilb John C | $237,550 |
Source: Public Records
Tax History
| Year | Tax Paid | Tax Assessment Tax Assessment Total Assessment is a certain percentage of the fair market value that is determined by local assessors to be the total taxable value of land and additions on the property. | Land | Improvement |
|---|---|---|---|---|
| 2025 | $5,714 | $438,200 | $141,800 | $296,400 |
| 2024 | $5,464 | $438,200 | $141,800 | $296,400 |
| 2023 | $4,347 | $237,300 | $78,400 | $158,900 |
| 2022 | $4,307 | $236,400 | $78,400 | $158,000 |
| 2021 | $4,326 | $236,400 | $78,400 | $158,000 |
| 2020 | $4,507 | $232,800 | $78,400 | $154,400 |
| 2019 | $4,081 | $232,800 | $78,400 | $154,400 |
| 2018 | $3,981 | $226,200 | $74,700 | $151,500 |
| 2017 | $3,874 | $225,900 | $74,400 | $151,500 |
| 2016 | $3,682 | $225,900 | $74,400 | $151,500 |
| 2014 | $3,592 | $225,900 | $74,400 | $151,500 |
| 2013 | $3,626 | $225,900 | $74,400 | $151,500 |
Source: Public Records
Map
Nearby Homes
- 33 Johnny Ln
- 3 Northland Dr
- 301 Long Swamp Rd
- 285 Long Swamp Rd
- TBD Long Swamp Timber Landing Rd
- Lot 032/6A Mayflower Ln Unit Map RO2 Lot 32/06A1
- 13 Tomahawk Ln
- 153 Eagle Dr
- 27 Murray Dr
- 11 Old Ryefield Rd
- 71 Diamondback Dr
- 70 Diamondback Dr
- 166 Eagle Dr
- 88 Eagle Dr
- 169 Eagle Dr
- 46 Blair Dr
- 302 Lower Cross Rd
- 68 Diamondback Dr
- 79 Diamondback Dr
- 63 Diamondback Dr
Your Personal Tour Guide
Ask me questions while you tour the home.