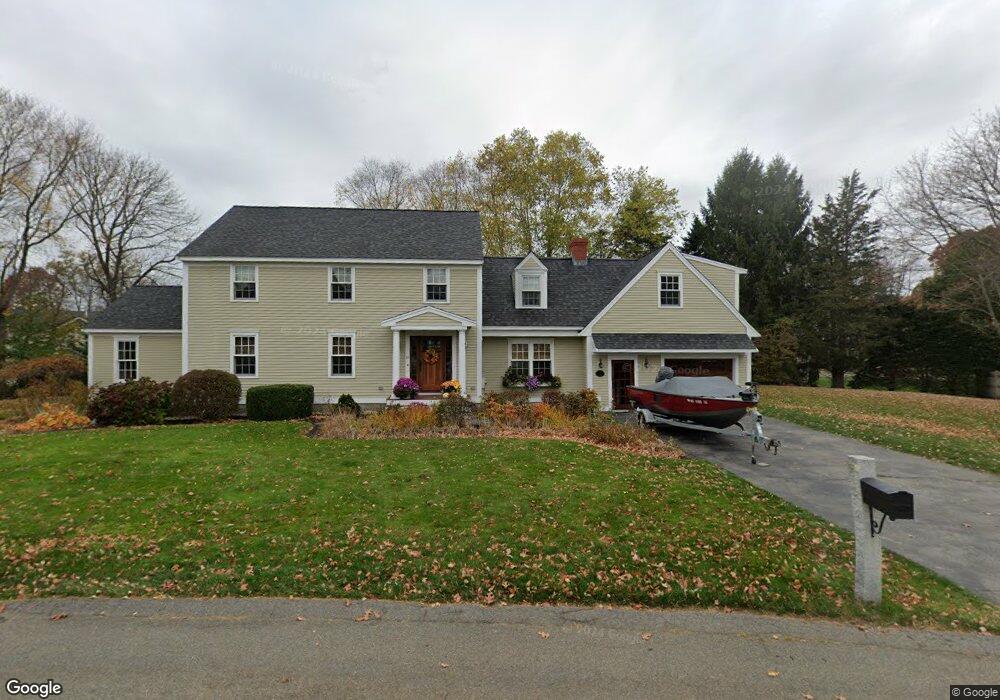
12 Jones Dr Newburyport, MA 01950
Estimated Value: $1,267,000 - $1,468,000
4
Beds
3
Baths
2,483
Sq Ft
$554/Sq Ft
Est. Value
About This Home
This home is located at 12 Jones Dr, Newburyport, MA 01950 and is currently estimated at $1,374,390, approximately $553 per square foot. 12 Jones Dr is a home located in Essex County with nearby schools including Francis T. Bresnahan Elementary School, Edward G. Molin Elementary School, and Rupert A. Nock Middle School.
Ownership History
Date
Name
Owned For
Owner Type
Purchase Details
Closed on
May 18, 2018
Sold by
Bean Julie M and Bean Thomas A
Bought by
Juie M Bran Ret
Current Estimated Value
Purchase Details
Closed on
May 18, 2001
Sold by
Fiascone James A and Fiascone Ellen L
Bought by
Bean Thomas A and Bean Julie M
Purchase Details
Closed on
Jul 18, 1991
Sold by
Storey Ave Rt
Bought by
Fiascone James A and Ellen L Fiascone
Create a Home Valuation Report for This Property
The Home Valuation Report is an in-depth analysis detailing your home's value as well as a comparison with similar homes in the area
Home Values in the Area
Average Home Value in this Area
Purchase History
| Date | Buyer | Sale Price | Title Company |
|---|---|---|---|
| Juie M Bran Ret | -- | -- | |
| Bean Thomas A | $449,900 | -- | |
| Fiascone James A | $227,900 | -- |
Source: Public Records
Mortgage History
| Date | Status | Borrower | Loan Amount |
|---|---|---|---|
| Previous Owner | Fiascone James A | $450,000 | |
| Previous Owner | Fiascone James A | $322,700 | |
| Previous Owner | Fiascone James A | $23,300 |
Source: Public Records
Tax History Compared to Growth
Tax History
| Year | Tax Paid | Tax Assessment Tax Assessment Total Assessment is a certain percentage of the fair market value that is determined by local assessors to be the total taxable value of land and additions on the property. | Land | Improvement |
|---|---|---|---|---|
| 2025 | $11,554 | $1,206,100 | $479,000 | $727,100 |
| 2024 | $11,228 | $1,126,200 | $435,500 | $690,700 |
| 2023 | $10,146 | $944,700 | $378,900 | $565,800 |
| 2022 | $10,057 | $837,400 | $315,800 | $521,600 |
| 2021 | $9,316 | $737,000 | $287,300 | $449,700 |
| 2020 | $9,196 | $716,200 | $287,300 | $428,900 |
| 2019 | $9,368 | $716,200 | $287,300 | $428,900 |
| 2018 | $8,859 | $668,100 | $273,800 | $394,300 |
| 2017 | $8,905 | $662,100 | $260,800 | $401,300 |
| 2016 | $8,323 | $621,600 | $237,600 | $384,000 |
| 2015 | $8,292 | $621,600 | $237,600 | $384,000 |
Source: Public Records
Map
Nearby Homes