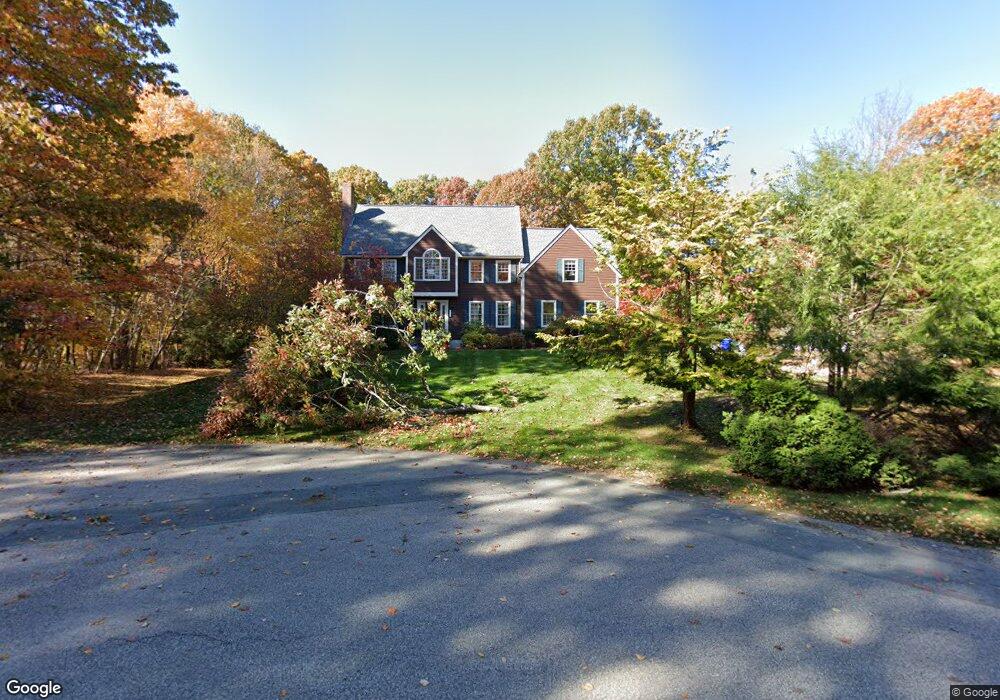
12 Joseph Rd Hopkinton, MA 01748
Estimated Value: $1,071,000 - $1,235,000
4
Beds
3
Baths
3,168
Sq Ft
$365/Sq Ft
Est. Value
About This Home
This home is located at 12 Joseph Rd, Hopkinton, MA 01748 and is currently estimated at $1,155,735, approximately $364 per square foot. 12 Joseph Rd is a home located in Middlesex County with nearby schools including Marathon Elementary School, Hopkins Elementary School, and Elmwood Elementary School.
Ownership History
Date
Name
Owned For
Owner Type
Purchase Details
Closed on
Aug 27, 2003
Sold by
Schiavone Francis X and Schiavone Mary Lou
Bought by
Crum Jeffrey S and Crum Karen
Current Estimated Value
Home Financials for this Owner
Home Financials are based on the most recent Mortgage that was taken out on this home.
Original Mortgage
$484,000
Outstanding Balance
$216,001
Interest Rate
5.69%
Mortgage Type
Purchase Money Mortgage
Estimated Equity
$939,734
Create a Home Valuation Report for This Property
The Home Valuation Report is an in-depth analysis detailing your home's value as well as a comparison with similar homes in the area
Home Values in the Area
Average Home Value in this Area
Purchase History
| Date | Buyer | Sale Price | Title Company |
|---|---|---|---|
| Crum Jeffrey S | $605,000 | -- |
Source: Public Records
Mortgage History
| Date | Status | Borrower | Loan Amount |
|---|---|---|---|
| Open | Crum Jeffrey S | $484,000 |
Source: Public Records
Tax History Compared to Growth
Tax History
| Year | Tax Paid | Tax Assessment Tax Assessment Total Assessment is a certain percentage of the fair market value that is determined by local assessors to be the total taxable value of land and additions on the property. | Land | Improvement |
|---|---|---|---|---|
| 2025 | $12,712 | $896,500 | $384,800 | $511,700 |
| 2024 | $12,516 | $856,700 | $366,100 | $490,600 |
| 2023 | $12,005 | $759,300 | $300,800 | $458,500 |
| 2022 | $11,786 | $692,100 | $273,400 | $418,700 |
| 2021 | $11,459 | $670,900 | $265,200 | $405,700 |
| 2020 | $10,948 | $650,900 | $258,900 | $392,000 |
| 2019 | $10,407 | $606,100 | $254,000 | $352,100 |
| 2018 | $9,878 | $584,500 | $242,000 | $342,500 |
| 2017 | $9,552 | $568,600 | $234,900 | $333,700 |
| 2016 | $9,440 | $554,300 | $230,300 | $324,000 |
| 2015 | $9,431 | $525,100 | $223,500 | $301,600 |
Source: Public Records
Map
Nearby Homes
- 4 Angelo Dr
- 165 Lumber St
- 40 Sanctuary Ln
- 15 Chamberlain St
- 211 Hayden Rowe St
- 11 Cole Dr Unit 11
- 22 Mcneil Cir
- 4 Lowell Dr
- 7 Davenport Ln Unit 7
- 11 Myrtle Ave Unit 5
- 16 Fitch Ave Unit 6
- 14 Fitch Ave Unit 7
- 13 Fitch Ave
- 13 Fitch Ave Unit 19
- 12 Fitch Ave Unit 8
- 7 Myrtle Ave Unit 3
- 11 Fitch Ave Unit 18
- 2 Emerald Dr
- 10 Fitch Ave Unit 9
- 5 Myrtle Ave Unit 2