Estimated Value: $500,000 - $582,000
4
Beds
2
Baths
1,233
Sq Ft
$437/Sq Ft
Est. Value
About This Home
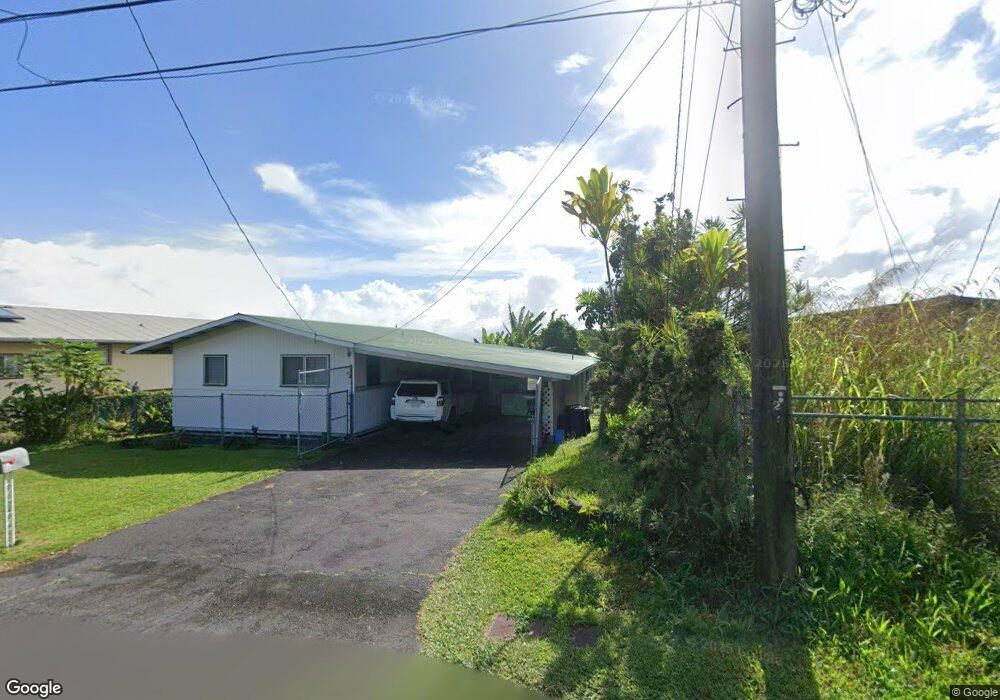
This home is located at 12 Kaapuni Loop, Hilo, HI 96720 and is currently estimated at $538,460, approximately $436 per square foot. 12 Kaapuni Loop is a home located in Hawaii County with nearby schools including Ka'umana Elementary School, Hilo Intermediate School, and Hilo High School.
Ownership History
Date
Name
Owned For
Owner Type
Purchase Details
Closed on
Feb 20, 2024
Sold by
Farmer Solomon David
Bought by
Lott Lyndis
Current Estimated Value
Purchase Details
Closed on
Mar 26, 2005
Sold by
Farmer Solomon D Lott and Farmer Lyndis M Lott
Bought by
Farmer Solomon D Lott and Farmer Lyndis M Lott
Home Financials for this Owner
Home Financials are based on the most recent Mortgage that was taken out on this home.
Original Mortgage
$136,000
Interest Rate
5.6%
Mortgage Type
Stand Alone Refi Refinance Of Original Loan
Purchase Details
Closed on
Dec 18, 1998
Sold by
Bankers Trust Company
Bought by
Farmer Solomon D and Lott Lyndis M
Home Financials for this Owner
Home Financials are based on the most recent Mortgage that was taken out on this home.
Original Mortgage
$76,200
Interest Rate
6.73%
Mortgage Type
Purchase Money Mortgage
Purchase Details
Closed on
Jul 8, 1998
Sold by
Wold Pedar C
Bought by
Bankers Trust Company
Create a Home Valuation Report for This Property
The Home Valuation Report is an in-depth analysis detailing your home's value as well as a comparison with similar homes in the area
Home Values in the Area
Average Home Value in this Area
Purchase History
| Date | Buyer | Sale Price | Title Company |
|---|---|---|---|
| Lott Lyndis | -- | None Listed On Document | |
| Farmer Solomon D Lott | -- | Fntic | |
| Farmer Solomon D | $78,600 | -- | |
| Bankers Trust Company | $85,000 | -- |
Source: Public Records
Mortgage History
| Date | Status | Borrower | Loan Amount |
|---|---|---|---|
| Previous Owner | Farmer Solomon D Lott | $136,000 | |
| Previous Owner | Farmer Solomon D | $76,200 |
Source: Public Records
Tax History
| Year | Tax Paid | Tax Assessment Tax Assessment Total Assessment is a certain percentage of the fair market value that is determined by local assessors to be the total taxable value of land and additions on the property. | Land | Improvement |
|---|---|---|---|---|
| 2025 | $653 | $205,600 | $42,500 | $163,100 |
| 2024 | $653 | $199,600 | $42,500 | $157,100 |
| 2023 | $646 | $193,800 | $42,500 | $151,300 |
| 2022 | $680 | $188,200 | $42,500 | $145,700 |
| 2021 | $653 | $182,700 | $42,500 | $140,200 |
| 2020 | $627 | $177,400 | $42,500 | $134,900 |
| 2019 | $601 | $172,200 | $42,500 | $129,700 |
| 2018 | $577 | $167,200 | $42,500 | $124,700 |
| 2017 | $552 | $162,300 | $42,500 | $119,800 |
| 2016 | $530 | $157,600 | $42,500 | $115,100 |
Source: Public Records
Map
Nearby Homes
- 6 Wawai Loop
- 107 Kaikuono St
- 144 Chong St
- 36 Lawelawe Cir
- 24 Manu Place
- 77 Terrace Dr
- 7 Luana Way
- 1360 Kaumana Dr
- 0 Kukuau St Unit 729437
- 0 Puainako St Extension Unit 729354
- 1379 Mele Manu St
- 2690 Kuku St
- 497 Makanaa St
- 100 Laukona St
- 105 Lahaina St
- 1706 Waianuenue Ave
- 1808 Waianuenue Ave
- 18 N Iwaiwa St
- 1687 Wailuku Dr
- 1766 Wailuku Dr
- 8 Kaapuni Loop
- 16 Kaapuni Loop
- 966C Kaumana Dr
- 4 Kaapuni Loop
- 10 Kaapuni Place
- 26 Hokulani St
- 26 Hokulani St Unit 1
- 11 Kaapuni Loop
- 22 Hokulani St
- 44 Hokulani St
- 44 Hokulani St Unit N
- 25 Kaapuni Loop
- 18 Hokulani St
- 1 Kaapuni Place
- 18 Kaapuni Place
- 7 Kaapuni Place
- 46 Hokulani St
- 29 Hokulani St
- 35 Hokulani St
- 29 Kaapuni Loop
Your Personal Tour Guide
Ask me questions while you tour the home.