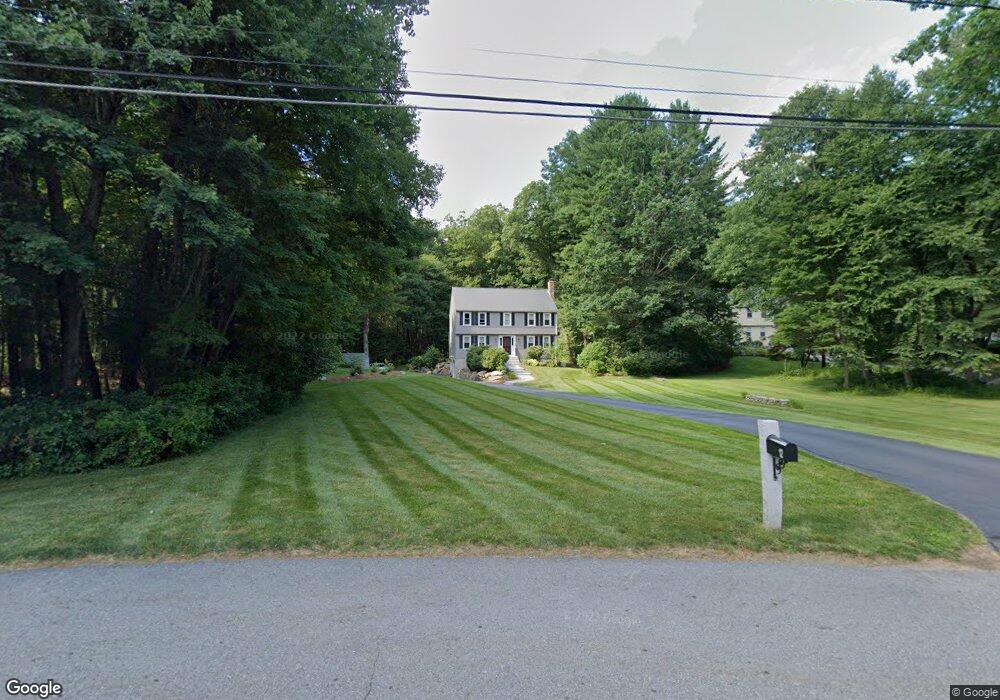
12 Kings Row Ashland, MA 01721
Estimated Value: $842,000 - $971,000
3
Beds
3
Baths
2,258
Sq Ft
$401/Sq Ft
Est. Value
About This Home
This home is located at 12 Kings Row, Ashland, MA 01721 and is currently estimated at $906,202, approximately $401 per square foot. 12 Kings Row is a home located in Middlesex County with nearby schools including William Pittaway Elementary School, David Mindess Elementary School, and Henry E. Warren Elementary School.
Ownership History
Date
Name
Owned For
Owner Type
Purchase Details
Closed on
Dec 17, 1999
Sold by
Snider John C and Snider Mona M
Bought by
Dinerman Bradley J and Dinerman Davida R
Current Estimated Value
Purchase Details
Closed on
Jul 26, 1996
Sold by
Hansen Walter J
Bought by
Snider Ii John C and Snnider Mona M
Purchase Details
Closed on
Sep 22, 1988
Sold by
Walker William G
Bought by
Hansen Walter J
Create a Home Valuation Report for This Property
The Home Valuation Report is an in-depth analysis detailing your home's value as well as a comparison with similar homes in the area
Home Values in the Area
Average Home Value in this Area
Purchase History
| Date | Buyer | Sale Price | Title Company |
|---|---|---|---|
| Dinerman Bradley J | $297,000 | -- | |
| Snider Ii John C | $239,900 | -- | |
| Hansen Walter J | $260,000 | -- |
Source: Public Records
Mortgage History
| Date | Status | Borrower | Loan Amount |
|---|---|---|---|
| Open | Hansen Walter J | $248,500 | |
| Closed | Hansen Walter J | $257,000 |
Source: Public Records
Tax History Compared to Growth
Tax History
| Year | Tax Paid | Tax Assessment Tax Assessment Total Assessment is a certain percentage of the fair market value that is determined by local assessors to be the total taxable value of land and additions on the property. | Land | Improvement |
|---|---|---|---|---|
| 2025 | $9,392 | $735,500 | $280,700 | $454,800 |
| 2024 | $9,194 | $694,400 | $280,700 | $413,700 |
| 2023 | $8,396 | $609,700 | $267,500 | $342,200 |
| 2022 | $8,528 | $537,000 | $242,900 | $294,100 |
| 2021 | $8,120 | $509,700 | $242,900 | $266,800 |
| 2020 | $14,367 | $488,400 | $243,000 | $245,400 |
| 2019 | $7,593 | $466,400 | $243,000 | $223,400 |
| 2018 | $7,523 | $452,900 | $240,600 | $212,300 |
| 2017 | $7,406 | $443,500 | $239,400 | $204,100 |
| 2016 | $7,174 | $422,000 | $236,400 | $185,600 |
| 2015 | $7,060 | $408,100 | $226,500 | $181,600 |
| 2014 | $6,822 | $392,300 | $192,600 | $199,700 |
Source: Public Records
Map
Nearby Homes
- 0 Cordaville Rd
- 2 High Ridge Rd
- 0 Oak St
- 3 Johnson St
- 22 Irene Cir
- 23 Teller Dr
- 265 Pleasant St
- 203 Pleasant St
- 8 Pilgrim Rd
- 9 Wentworth Dr
- 94 Pleasant St Unit 96
- 41 Darlene Dr
- 12 Braeburn Ln
- 20 Braeburn Ln
- 23 Stonebrook Ct Unit 11
- 3 Blueberry Hill Ln
- 0 Cross St
- 9 Oregon Rd
- 39 Woodbury Rd
- 37 Park Rd Unit R