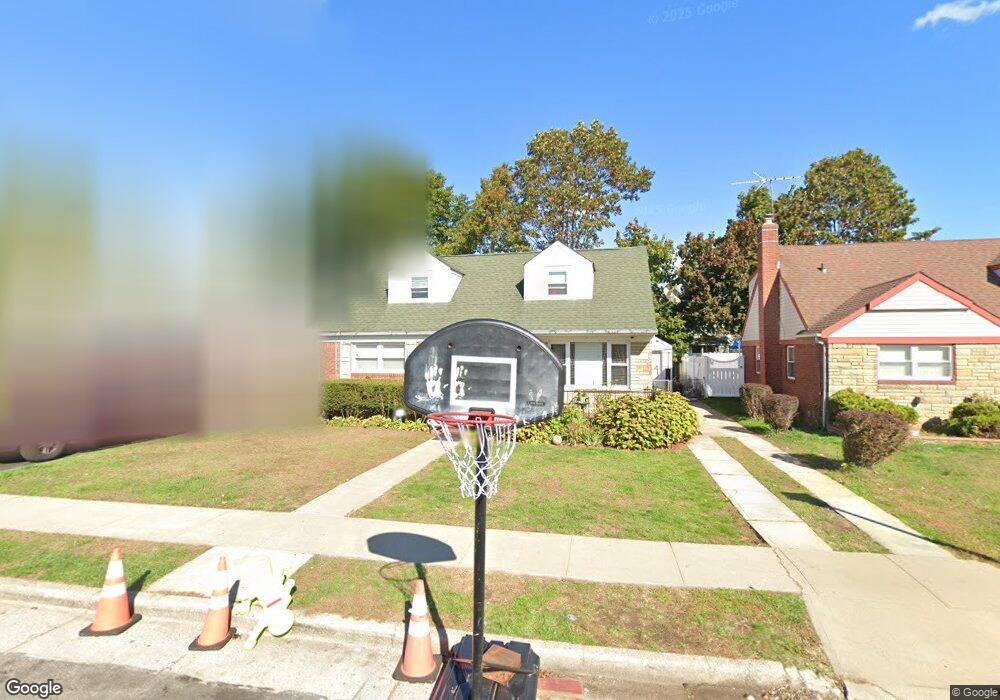
12 Koeppel Place Hempstead, NY 11550
Estimated Value: $325,000 - $618,498
4
Beds
2
Baths
1,294
Sq Ft
$365/Sq Ft
Est. Value
About This Home
This home is located at 12 Koeppel Place, Hempstead, NY 11550 and is currently estimated at $471,749, approximately $364 per square foot. 12 Koeppel Place is a home located in Nassau County.
Ownership History
Date
Name
Owned For
Owner Type
Purchase Details
Closed on
Nov 28, 2017
Sold by
Nabibaksh Ajib
Bought by
Nabibaksh Faraz and Nabibaksh Ajib
Current Estimated Value
Home Financials for this Owner
Home Financials are based on the most recent Mortgage that was taken out on this home.
Original Mortgage
$61,922
Outstanding Balance
$52,714
Interest Rate
4.38%
Mortgage Type
New Conventional
Estimated Equity
$419,035
Purchase Details
Closed on
Oct 23, 2015
Sold by
12 Koeppel Place Holding Llc
Bought by
Nabibaksh Ajib
Home Financials for this Owner
Home Financials are based on the most recent Mortgage that was taken out on this home.
Original Mortgage
$157,320
Outstanding Balance
$123,778
Interest Rate
3.88%
Mortgage Type
Purchase Money Mortgage
Estimated Equity
$347,971
Purchase Details
Closed on
Dec 13, 2006
Sold by
Deutsche Bank National Tr
Purchase Details
Closed on
Sep 6, 2005
Sold by
Reilly David T
Purchase Details
Closed on
Oct 13, 2003
Sold by
St Rose Lavern
Bought by
Taylor Herbert
Purchase Details
Closed on
Aug 14, 1998
Create a Home Valuation Report for This Property
The Home Valuation Report is an in-depth analysis detailing your home's value as well as a comparison with similar homes in the area
Home Values in the Area
Average Home Value in this Area
Purchase History
| Date | Buyer | Sale Price | Title Company |
|---|---|---|---|
| Nabibaksh Faraz | -- | None Available | |
| Nabibaksh Ajib | $196,650 | The Judicial Title Insurance | |
| -- | $315,000 | -- | |
| -- | $282,600 | -- | |
| Taylor Herbert | $280,000 | -- | |
| -- | -- | -- |
Source: Public Records
Mortgage History
| Date | Status | Borrower | Loan Amount |
|---|---|---|---|
| Open | Nabibaksh Faraz | $61,922 | |
| Open | Nabibaksh Ajib | $157,320 |
Source: Public Records
Tax History Compared to Growth
Tax History
| Year | Tax Paid | Tax Assessment Tax Assessment Total Assessment is a certain percentage of the fair market value that is determined by local assessors to be the total taxable value of land and additions on the property. | Land | Improvement |
|---|---|---|---|---|
| 2025 | $7,740 | $305 | $105 | $200 |
| 2024 | $812 | $321 | $111 | $210 |
| 2023 | $7,448 | $321 | $111 | $210 |
| 2022 | $7,448 | $321 | $111 | $210 |
| 2021 | $10,459 | $320 | $111 | $209 |
| 2020 | $7,168 | $385 | $384 | $1 |
| 2019 | $6,495 | $379 | $296 | $83 |
| 2018 | $6,145 | $404 | $0 | $0 |
| 2017 | $6,702 | $513 | $337 | $176 |
| 2016 | $7,600 | $513 | $337 | $176 |
| 2015 | $1,020 | $609 | $400 | $209 |
| 2014 | $1,020 | $609 | $400 | $209 |
| 2013 | $944 | $609 | $400 | $209 |
Source: Public Records
Map
Nearby Homes
- 15 Koeppel Place
- 42 Peters Ave
- 140 Baldwin Rd
- 29 Sterling Place
- 23 Peters Ave
- 36 Monroe Place
- 66 Pierson Ave
- 101 Baldwin Rd
- 16 Garfield Place
- 44 Nassau Pkwy
- 120 Oak Ave
- 70 Baldwin Rd
- 182 Long Beach Rd
- 22 Hudson Place
- 81 Baldwin Rd
- 89 Elizabeth Ave
- 141 Brown Ave
- 75 Baldwin Rd
- 54 Kane Ave
- 34 Oakland St
- 8 Koeppel Place
- 16 Koeppel Place
- 70 Long Beach Rd
- 106 Peters Ave
- 110 Peters Ave Unit 112
- 20 Koeppel Place
- 98 Peters Ave
- 90 Ingraham St
- 9 Koeppel Place
- 21 Koeppel Place
- 94 Peters Ave
- 80 Long Beach Rd
- 24 Koeppel Place
- 88 Peters Ave
- 28 Koeppel Place
- 37 Koeppel Place
- 88 Long Beach Rd
- 88 Long Beach Rd Unit 2 Fl
- 91 Ingraham St
- 75 Long Beach Rd