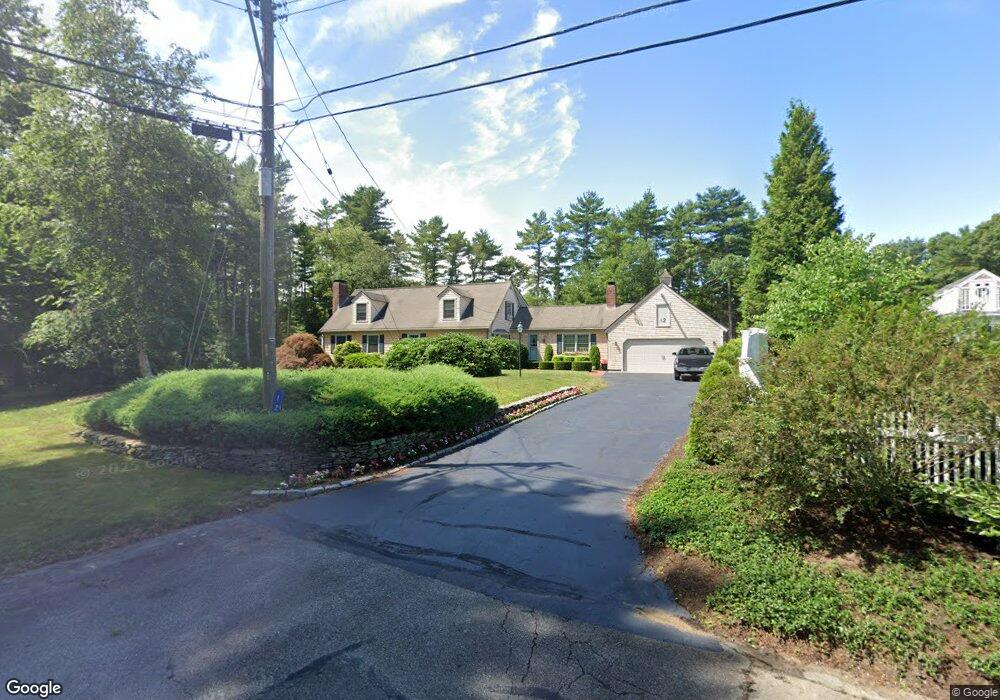
12 Lebaron Way Mattapoisett, MA 02739
Estimated Value: $769,000 - $919,181
4
Beds
3
Baths
2,812
Sq Ft
$309/Sq Ft
Est. Value
About This Home
This home is located at 12 Lebaron Way, Mattapoisett, MA 02739 and is currently estimated at $870,295, approximately $309 per square foot. 12 Lebaron Way is a home located in Plymouth County with nearby schools including Center School, Old Hammondtown Elementary, and Old Rochester Regional High School.
Ownership History
Date
Name
Owned For
Owner Type
Purchase Details
Closed on
Nov 27, 2018
Sold by
Renzi Michael and Renzi Kathleen
Bought by
Michael Renzi Ft and Renzi
Current Estimated Value
Purchase Details
Closed on
Oct 2, 2013
Sold by
Renzi Michael and Renzi Kathleen
Bought by
12 Lebaron Way Nt and Renzi
Home Financials for this Owner
Home Financials are based on the most recent Mortgage that was taken out on this home.
Original Mortgage
$70,000
Interest Rate
4.61%
Mortgage Type
New Conventional
Purchase Details
Closed on
Sep 4, 2001
Sold by
Gingras Robert A
Bought by
Renzi Michael and Renzi Kathleen
Create a Home Valuation Report for This Property
The Home Valuation Report is an in-depth analysis detailing your home's value as well as a comparison with similar homes in the area
Home Values in the Area
Average Home Value in this Area
Purchase History
| Date | Buyer | Sale Price | Title Company |
|---|---|---|---|
| Michael Renzi Ft | -- | -- | |
| Michael Renzi Ft | -- | -- | |
| Michael Renzi Ft | -- | -- | |
| Michael Renzi Ft | -- | -- | |
| Renzi Michael | -- | -- | |
| Renzi Michael | -- | -- | |
| Renzi Michael | -- | -- | |
| Renzi Michael | -- | -- | |
| 12 Lebaron Way Nt | -- | -- | |
| 12 Lebaron Way Nt | -- | -- | |
| 12 Lebaron Way Nt | -- | -- | |
| Renzi Michael | $7,500 | -- | |
| Renzi Michael | $7,500 | -- |
Source: Public Records
Mortgage History
| Date | Status | Borrower | Loan Amount |
|---|---|---|---|
| Previous Owner | 12 Lebaron Way Nt | $70,000 | |
| Previous Owner | 12 Lebaron Way Nt | $150,000 |
Source: Public Records
Tax History Compared to Growth
Tax History
| Year | Tax Paid | Tax Assessment Tax Assessment Total Assessment is a certain percentage of the fair market value that is determined by local assessors to be the total taxable value of land and additions on the property. | Land | Improvement |
|---|---|---|---|---|
| 2025 | $8,397 | $780,400 | $280,700 | $499,700 |
| 2024 | $8,141 | $774,600 | $280,700 | $493,900 |
| 2023 | $8,170 | $726,200 | $242,600 | $483,600 |
| 2022 | $7,836 | $631,900 | $205,700 | $426,200 |
| 2021 | $7,046 | $543,700 | $188,800 | $354,900 |
| 2020 | $6,634 | $491,800 | $181,000 | $310,800 |
| 2019 | $6,268 | $474,500 | $163,700 | $310,800 |
| 2018 | $6,027 | $462,900 | $145,400 | $317,500 |
| 2017 | $6,045 | $462,500 | $159,600 | $302,900 |
| 2016 | $5,626 | $426,200 | $152,500 | $273,700 |
| 2015 | $5,597 | $430,500 | $156,800 | $273,700 |
| 2014 | $5,395 | $424,100 | $156,800 | $267,300 |
Source: Public Records
Map
Nearby Homes
- 13 Park Place
- 9 Hitching Post Rd
- 47 Fairhaven Rd
- 19 High Ridge Dr
- 35 North St
- 8 Abby Ln
- 7 Pearl St
- 12 Cannon St
- 83 Fairhaven Rd
- 7 Laura Ln
- 0 Long Plain Rd
- 52 Prince Snow Cir
- 8 Captains Ln
- 2 Golf Cottage Way
- 4 Golf Cottage Way
- 11 Captains Ln
- 31 Split Rock Ln
- 3 Brandt Island Rd
- 225 Mattapoisett Rd
- 421 Huttleston Ave