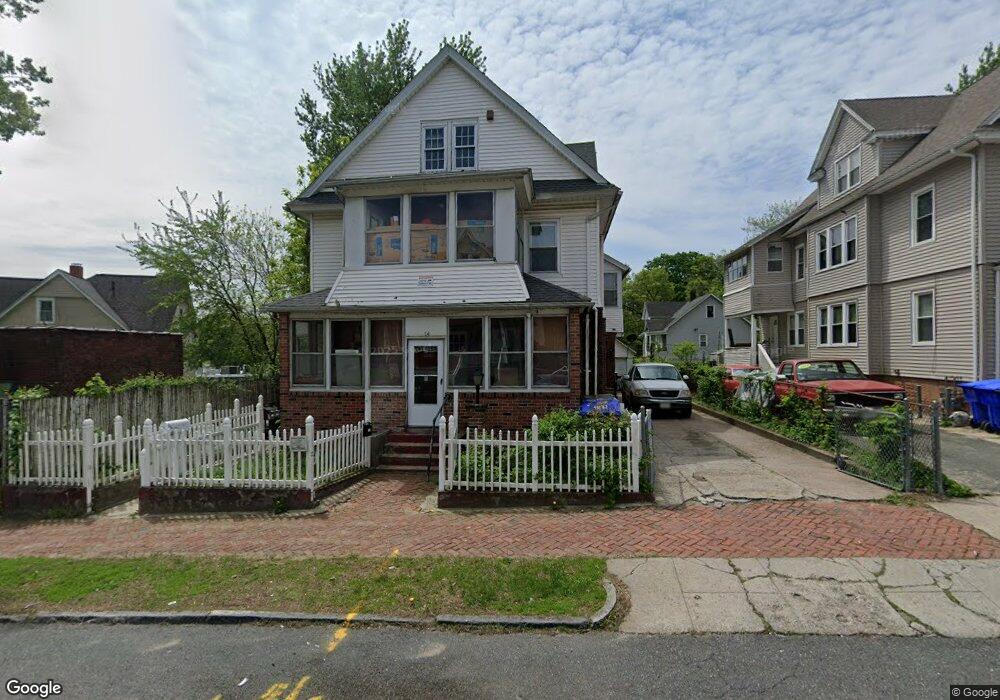
12 Ledyard St Unit 14 Springfield, MA 01104
Liberty Heights NeighborhoodEstimated Value: $273,000 - $422,000
8
Beds
4
Baths
2,657
Sq Ft
$129/Sq Ft
Est. Value
About This Home
This home is located at 12 Ledyard St Unit 14, Springfield, MA 01104 and is currently estimated at $342,666, approximately $128 per square foot. 12 Ledyard St Unit 14 is a home located in Hampden County with nearby schools including Frank H. Freedman School, High School Of Commerce, and Springfield High School of Science and Technology.
Ownership History
Date
Name
Owned For
Owner Type
Purchase Details
Closed on
Dec 16, 2018
Sold by
Maldonaldo Sara
Bought by
J & W Feng Llc
Current Estimated Value
Purchase Details
Closed on
Jun 20, 2008
Sold by
Rodriguez Nelson A
Bought by
Rodriguez Sara
Purchase Details
Closed on
Jun 15, 2001
Sold by
Cameron Moises and Gonzalez Jassiry
Bought by
Rodriguez Sara and Rodriguez Nelson
Home Financials for this Owner
Home Financials are based on the most recent Mortgage that was taken out on this home.
Original Mortgage
$85,425
Interest Rate
7.15%
Mortgage Type
Purchase Money Mortgage
Purchase Details
Closed on
Oct 22, 1997
Sold by
John R Oshea Ret and Oshea John R
Bought by
Cameron Moises and Gonzales Jassiry
Home Financials for this Owner
Home Financials are based on the most recent Mortgage that was taken out on this home.
Original Mortgage
$58,420
Interest Rate
7.14%
Create a Home Valuation Report for This Property
The Home Valuation Report is an in-depth analysis detailing your home's value as well as a comparison with similar homes in the area
Home Values in the Area
Average Home Value in this Area
Purchase History
| Date | Buyer | Sale Price | Title Company |
|---|---|---|---|
| J & W Feng Llc | $140,000 | -- | |
| Rodriguez Sara | -- | -- | |
| Rodriguez Sara | $100,500 | -- | |
| Cameron Moises | $71,000 | -- |
Source: Public Records
Mortgage History
| Date | Status | Borrower | Loan Amount |
|---|---|---|---|
| Previous Owner | Cameron Moises | $85,425 | |
| Previous Owner | Cameron Moises | $58,420 | |
| Previous Owner | Cameron Moises | $69,530 | |
| Closed | Cameron Moises | $10,000 |
Source: Public Records
Tax History
| Year | Tax Paid | Tax Assessment Tax Assessment Total Assessment is a certain percentage of the fair market value that is determined by local assessors to be the total taxable value of land and additions on the property. | Land | Improvement |
|---|---|---|---|---|
| 2025 | $3,545 | $226,100 | $30,000 | $196,100 |
| 2024 | $3,617 | $225,200 | $30,000 | $195,200 |
| 2023 | $3,250 | $190,600 | $27,300 | $163,300 |
| 2022 | $3,762 | $199,900 | $25,500 | $174,400 |
| 2021 | $3,243 | $171,600 | $23,200 | $148,400 |
| 2020 | $2,902 | $148,600 | $23,200 | $125,400 |
| 2019 | $2,558 | $130,000 | $23,200 | $106,800 |
| 2018 | $2,355 | $125,500 | $23,200 | $102,300 |
| 2017 | $2,355 | $119,800 | $16,800 | $103,000 |
| 2016 | $2,074 | $105,500 | $16,800 | $88,700 |
| 2015 | $2,004 | $101,900 | $16,800 | $85,100 |
Source: Public Records
Map
Nearby Homes
- 7 Ledyard St
- 9 Murray Hill Ave
- LOT 3 N S Worthington St
- 59 Ingersoll Grove
- 138 Magazine St
- 571-573 Carew St
- 774-776 Liberty St
- 708-710 Carew St
- 744-746 Carew St
- 9 Utica St
- 41 Florida St
- 107 Dartmouth St
- 69 Winter St
- 119 Littleton St
- 809 Carew St
- 63 Bay St
- 118 Wait St
- 146 Bay St
- 40 Byers St
- 123 Bay St
- 12-14 Ledyard St
- 14 Ledyard St
- 16 Ledyard St Unit 18
- 22 Ledyard St Unit 24
- 22-24 Ledyard St
- 23 Genesee St Unit 25
- 226 Armory St
- 29 Genesee St Unit 31
- 19 Genesee St
- 79 Ledyard St
- 9 Ledyard St Unit 9
- 26 Ledyard St Unit 28
- 19 Ledyard St
- 33 Genesee St Unit 1 flr
- 33 Genesee St Unit 35
- 33 Genesee St Unit 1
- 33-35 Genesee St
- 17 Ledyard St
- 26-28 Ledyard St
- 19-21 Ledyard St
Your Personal Tour Guide
Ask me questions while you tour the home.