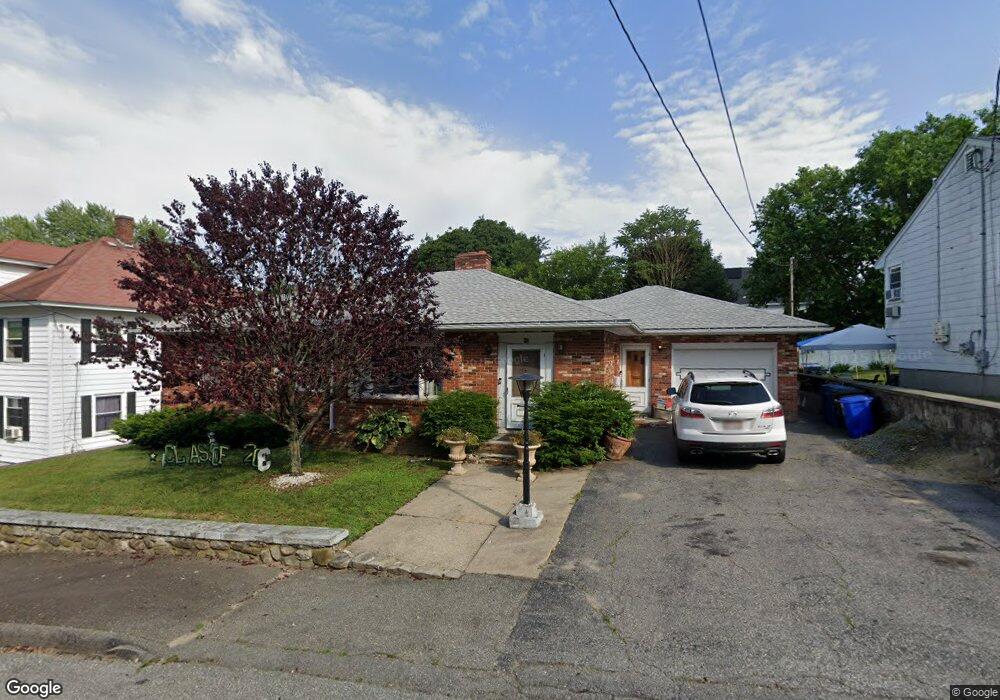
12 Linehan St Lawrence, MA 01841
Prospect Hill-Back Bay NeighborhoodEstimated Value: $526,000 - $606,000
3
Beds
2
Baths
1,547
Sq Ft
$369/Sq Ft
Est. Value
About This Home
This home is located at 12 Linehan St, Lawrence, MA 01841 and is currently estimated at $571,573, approximately $369 per square foot. 12 Linehan St is a home located in Essex County with nearby schools including School For Exceptional Studies, Community Day Charter Public School - Gateway, and Esperanza Academy School of Hope.
Ownership History
Date
Name
Owned For
Owner Type
Purchase Details
Closed on
Nov 30, 2004
Sold by
Est Trovato Mary and Coco Joseph J
Bought by
Rodriguez Jaime A and Baez Lucy M
Current Estimated Value
Home Financials for this Owner
Home Financials are based on the most recent Mortgage that was taken out on this home.
Original Mortgage
$253,555
Outstanding Balance
$127,150
Interest Rate
5.75%
Mortgage Type
Purchase Money Mortgage
Estimated Equity
$444,423
Create a Home Valuation Report for This Property
The Home Valuation Report is an in-depth analysis detailing your home's value as well as a comparison with similar homes in the area
Home Values in the Area
Average Home Value in this Area
Purchase History
| Date | Buyer | Sale Price | Title Company |
|---|---|---|---|
| Rodriguez Jaime A | $266,900 | -- |
Source: Public Records
Mortgage History
| Date | Status | Borrower | Loan Amount |
|---|---|---|---|
| Open | Rodriguez Jaime A | $253,555 |
Source: Public Records
Tax History
| Year | Tax Paid | Tax Assessment Tax Assessment Total Assessment is a certain percentage of the fair market value that is determined by local assessors to be the total taxable value of land and additions on the property. | Land | Improvement |
|---|---|---|---|---|
| 2025 | $4,731 | $537,600 | $155,700 | $381,900 |
| 2024 | $4,284 | $463,100 | $134,800 | $328,300 |
| 2023 | $4,817 | $474,100 | $134,800 | $339,300 |
| 2022 | $4,504 | $393,700 | $120,200 | $273,500 |
| 2021 | $4,191 | $341,600 | $120,200 | $221,400 |
| 2020 | $4,224 | $339,800 | $118,400 | $221,400 |
| 2019 | $4,083 | $298,500 | $94,600 | $203,900 |
| 2018 | $3,726 | $260,200 | $90,200 | $170,000 |
| 2017 | $3,599 | $234,600 | $83,200 | $151,400 |
| 2016 | $3,572 | $230,300 | $74,400 | $155,900 |
| 2015 | $3,257 | $215,400 | $59,500 | $155,900 |
Source: Public Records
Map
Nearby Homes
- 106 Leroy Ave
- 39 Swan Ave
- 2 Leslie St
- 264 E Haverhill St Unit 2
- 14 Court St
- 32 Josephine Ave
- 18 Erhardt Terrace
- 12 Annette St
- 7 Erhardt Terrace
- 5 Kendrick St
- 192 Union St
- 25-27 Bicknell Ave
- 80-82 Haverhill St
- 89 Newbury St Unit 89B
- 91 Summer St Unit 2
- 27 Woodland Ct
- 68 Ashford St
- 52 Howard St
- 1 Riverview Blvd Unit 8-203
- 65 Arthur St
Your Personal Tour Guide
Ask me questions while you tour the home.