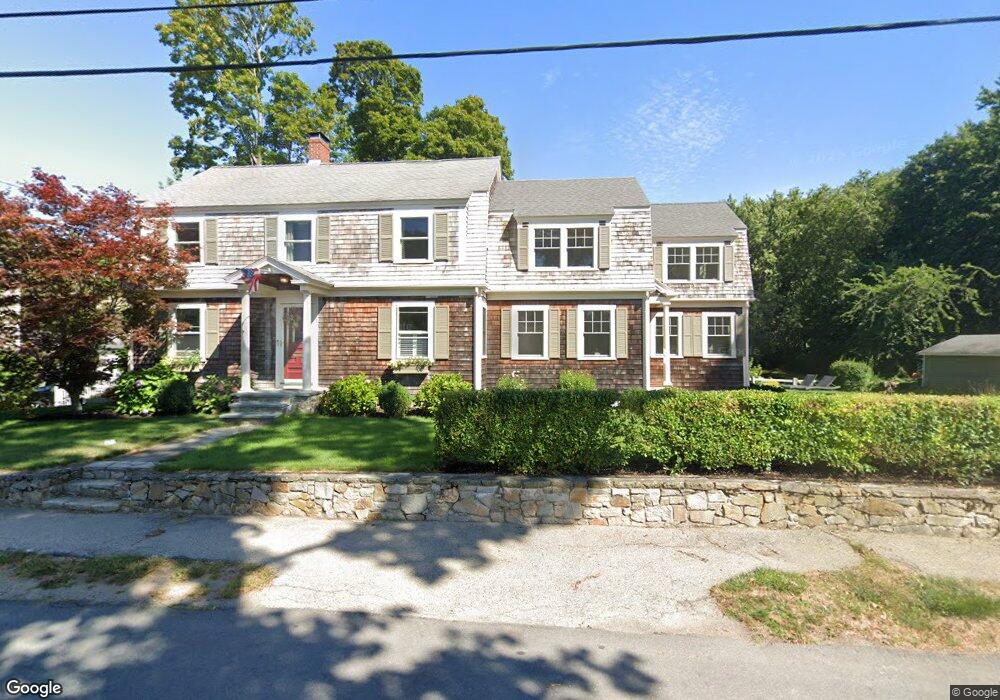
12 Linscott Rd Hingham, MA 02043
Estimated Value: $1,315,000 - $2,057,000
4
Beds
2
Baths
2,242
Sq Ft
$692/Sq Ft
Est. Value
About This Home
This home is located at 12 Linscott Rd, Hingham, MA 02043 and is currently estimated at $1,551,606, approximately $692 per square foot. 12 Linscott Rd is a home located in Plymouth County with nearby schools including East Elementary School, Hingham Middle School, and Hingham High School.
Ownership History
Date
Name
Owned For
Owner Type
Purchase Details
Closed on
Apr 9, 2020
Sold by
Robinson William S and Robinson Lehigh
Bought by
Robinson Ret
Current Estimated Value
Purchase Details
Closed on
Jun 30, 2004
Sold by
Whitmore George N and Whitmore Erin C
Bought by
Robinson William S and Robinson Katherine L
Purchase Details
Closed on
Oct 30, 1998
Sold by
Kirkpatrick Jane B and Kirkpatrick Steven W
Bought by
Whitmore George N and Whitmore Erin C
Purchase Details
Closed on
Sep 19, 1997
Sold by
Cham Kenneth E and Cham Marcia M
Bought by
Kirkpatrick Steven W and Kirkpatrick Jane B
Create a Home Valuation Report for This Property
The Home Valuation Report is an in-depth analysis detailing your home's value as well as a comparison with similar homes in the area
Purchase History
| Date | Buyer | Sale Price | Title Company |
|---|---|---|---|
| Robinson Ret | -- | None Available | |
| Robinson William S | $665,000 | -- | |
| Whitmore George N | $322,000 | -- | |
| Kirkpatrick Steven W | $260,000 | -- |
Source: Public Records
Mortgage History
| Date | Status | Borrower | Loan Amount |
|---|---|---|---|
| Previous Owner | Kirkpatrick Steven W | $88,700 | |
| Previous Owner | Kirkpatrick Steven W | $532,000 |
Source: Public Records
Tax History
| Year | Tax Paid | Tax Assessment Tax Assessment Total Assessment is a certain percentage of the fair market value that is determined by local assessors to be the total taxable value of land and additions on the property. | Land | Improvement |
|---|---|---|---|---|
| 2025 | $11,227 | $1,050,200 | $466,900 | $583,300 |
| 2024 | $10,862 | $1,001,100 | $466,900 | $534,200 |
| 2023 | $9,548 | $954,800 | $466,900 | $487,900 |
| 2022 | $9,085 | $785,900 | $389,100 | $396,800 |
| 2021 | $0 | $753,200 | $389,100 | $364,100 |
| 2020 | $0 | $753,200 | $389,100 | $364,100 |
| 2019 | $0 | $684,700 | $342,400 | $342,300 |
| 2018 | $8,059 | $684,700 | $342,400 | $342,300 |
| 2017 | $0 | $600,000 | $323,200 | $276,800 |
| 2016 | $7,017 | $561,800 | $307,800 | $254,000 |
| 2015 | $6,856 | $547,200 | $293,200 | $254,000 |
Source: Public Records
Map
Nearby Homes
Your Personal Tour Guide
Ask me questions while you tour the home.