12 Llewellyn Ln Royersford, PA 19468
Limerick Township NeighborhoodEstimated Value: $546,000 - $628,000
3
Beds
3
Baths
2,428
Sq Ft
$241/Sq Ft
Est. Value
About This Home
This home is located at 12 Llewellyn Ln, Royersford, PA 19468 and is currently estimated at $586,278, approximately $241 per square foot. 12 Llewellyn Ln is a home located in Montgomery County with nearby schools including Evans Elementary School, Spring-Ford Middle School 8th Grade Center, and Spring-Ford Middle School 5/6/7 Grade Center.
Ownership History
Date
Name
Owned For
Owner Type
Purchase Details
Closed on
Dec 29, 2009
Sold by
Casola Karen and Casola Kevin
Bought by
Demedio Stephen A
Current Estimated Value
Home Financials for this Owner
Home Financials are based on the most recent Mortgage that was taken out on this home.
Original Mortgage
$295,075
Outstanding Balance
$199,067
Interest Rate
5.5%
Mortgage Type
FHA
Estimated Equity
$387,211
Purchase Details
Closed on
Sep 22, 2003
Sold by
Barbet Christine R
Bought by
Casola Karen and Casola Kevin
Home Financials for this Owner
Home Financials are based on the most recent Mortgage that was taken out on this home.
Original Mortgage
$210,000
Interest Rate
6.25%
Purchase Details
Closed on
May 14, 2003
Sold by
Barbet Christine R and Barbet David B
Bought by
Barbet Christine R
Purchase Details
Closed on
Dec 3, 1999
Sold by
T H Properties
Bought by
Barbet David B and Barbet Christine R
Create a Home Valuation Report for This Property
The Home Valuation Report is an in-depth analysis detailing your home's value as well as a comparison with similar homes in the area
Home Values in the Area
Average Home Value in this Area
Purchase History
| Date | Buyer | Sale Price | Title Company |
|---|---|---|---|
| Demedio Stephen A | $325,000 | None Available | |
| Casola Karen | $275,000 | -- | |
| Barbet Christine R | -- | -- | |
| Barbet David B | $179,400 | -- |
Source: Public Records
Mortgage History
| Date | Status | Borrower | Loan Amount |
|---|---|---|---|
| Open | Demedio Stephen A | $295,075 | |
| Previous Owner | Casola Karen | $210,000 |
Source: Public Records
Tax History Compared to Growth
Tax History
| Year | Tax Paid | Tax Assessment Tax Assessment Total Assessment is a certain percentage of the fair market value that is determined by local assessors to be the total taxable value of land and additions on the property. | Land | Improvement |
|---|---|---|---|---|
| 2025 | $6,380 | $165,000 | $61,940 | $103,060 |
| 2024 | $6,380 | $165,000 | $61,940 | $103,060 |
| 2023 | $6,087 | $165,000 | $61,940 | $103,060 |
| 2022 | $5,881 | $165,000 | $61,940 | $103,060 |
| 2021 | $5,742 | $165,000 | $61,940 | $103,060 |
| 2020 | $5,597 | $165,000 | $61,940 | $103,060 |
| 2019 | $5,495 | $165,000 | $61,940 | $103,060 |
| 2018 | $4,231 | $165,000 | $61,940 | $103,060 |
| 2017 | $5,393 | $165,000 | $61,940 | $103,060 |
| 2016 | $5,329 | $165,000 | $61,940 | $103,060 |
| 2015 | $5,202 | $165,000 | $61,940 | $103,060 |
| 2014 | $5,099 | $165,000 | $61,940 | $103,060 |
Source: Public Records
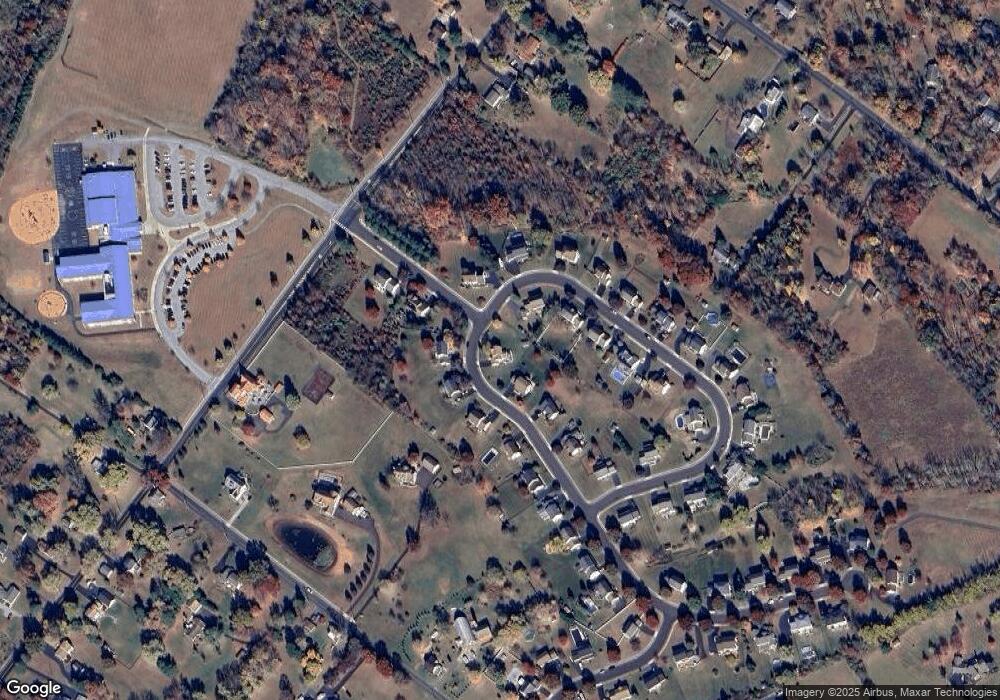
Map
Nearby Homes
- 55 Sunset Rd
- 1050 Moscariello Ln
- 72 Heffner Rd
- 165 W Ridge Pike Unit 201
- 119 N Limerick Rd
- 165 W Ridge Pike
- 165 W Ridge Pike Unit 257
- 88 Ironwood Dr
- 49 Copper Ct
- 138 Bradford Dr
- 137 Knock Hill Dr
- 169 Larrabee Way
- 121 Golden Vale Dr
- 108 Harland Ave
- 2002 Royal Ct
- 4208 Waterford Way
- 787 N Lewis Rd
- 609 Village Way
- 17 Lion Ct
- 104 Primrose Ln