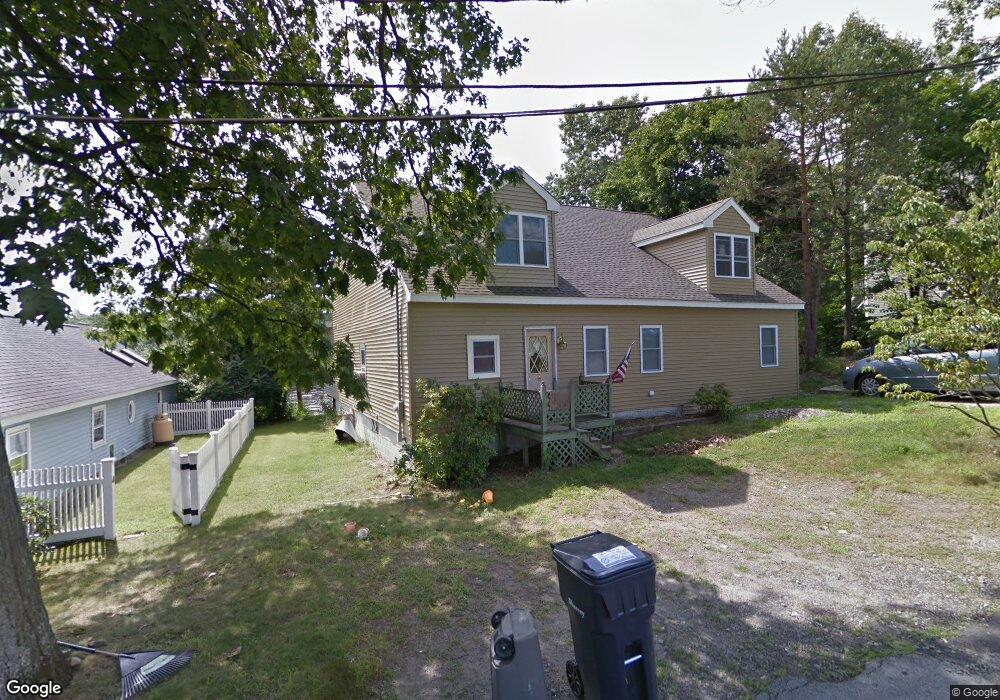
12 Logan Path North Grafton, MA 01536
Estimated Value: $519,000 - $650,186
3
Beds
1
Bath
1,113
Sq Ft
$522/Sq Ft
Est. Value
About This Home
This home is located at 12 Logan Path, North Grafton, MA 01536 and is currently estimated at $580,797, approximately $521 per square foot. 12 Logan Path is a home located in Worcester County with nearby schools including Grafton High School and Silver Spruce Montessori School.
Ownership History
Date
Name
Owned For
Owner Type
Purchase Details
Closed on
Oct 12, 2010
Sold by
Randell Amy F C and Cummins Amy F
Bought by
Randell Michael P and Randell Amy F
Current Estimated Value
Home Financials for this Owner
Home Financials are based on the most recent Mortgage that was taken out on this home.
Original Mortgage
$278,120
Outstanding Balance
$188,324
Interest Rate
4.87%
Mortgage Type
FHA
Estimated Equity
$392,473
Purchase Details
Closed on
Apr 27, 2000
Sold by
Cummins Dennis Michael and Cummins Susan Marie
Bought by
Cummins Amy F and Anderson Sean E
Purchase Details
Closed on
Nov 18, 1994
Sold by
Holden Anne K and Cosgro Karen L
Bought by
Cummins Dennis and Cummins Susan
Create a Home Valuation Report for This Property
The Home Valuation Report is an in-depth analysis detailing your home's value as well as a comparison with similar homes in the area
Home Values in the Area
Average Home Value in this Area
Purchase History
| Date | Buyer | Sale Price | Title Company |
|---|---|---|---|
| Randell Michael P | -- | -- | |
| Randell Michael P | -- | -- | |
| Randell Michael P | -- | -- | |
| Cummins Amy F | $145,000 | -- | |
| Cummins Amy F | $145,000 | -- | |
| Cummins Dennis | $10,000 | -- | |
| Cummins Dennis | $10,000 | -- |
Source: Public Records
Mortgage History
| Date | Status | Borrower | Loan Amount |
|---|---|---|---|
| Open | Randell Michael P | $278,120 | |
| Closed | Randell Michael P | $278,120 | |
| Previous Owner | Cummins Dennis | $156,500 |
Source: Public Records
Tax History Compared to Growth
Tax History
| Year | Tax Paid | Tax Assessment Tax Assessment Total Assessment is a certain percentage of the fair market value that is determined by local assessors to be the total taxable value of land and additions on the property. | Land | Improvement |
|---|---|---|---|---|
| 2025 | $8,006 | $574,300 | $145,300 | $429,000 |
| 2024 | $7,996 | $558,800 | $138,400 | $420,400 |
| 2023 | $7,384 | $470,000 | $138,400 | $331,600 |
| 2022 | $7,091 | $420,100 | $118,800 | $301,300 |
| 2021 | $6,920 | $402,800 | $108,000 | $294,800 |
| 2020 | $6,447 | $390,700 | $108,000 | $282,700 |
| 2019 | $5,703 | $342,300 | $104,900 | $237,400 |
| 2018 | $5,372 | $323,800 | $104,700 | $219,100 |
| 2017 | $4,895 | $298,500 | $79,400 | $219,100 |
| 2016 | $5,184 | $309,500 | $83,000 | $226,500 |
| 2015 | $5,217 | $316,200 | $83,000 | $233,200 |
| 2014 | $4,372 | $286,500 | $92,000 | $194,500 |
Source: Public Records
Map
Nearby Homes