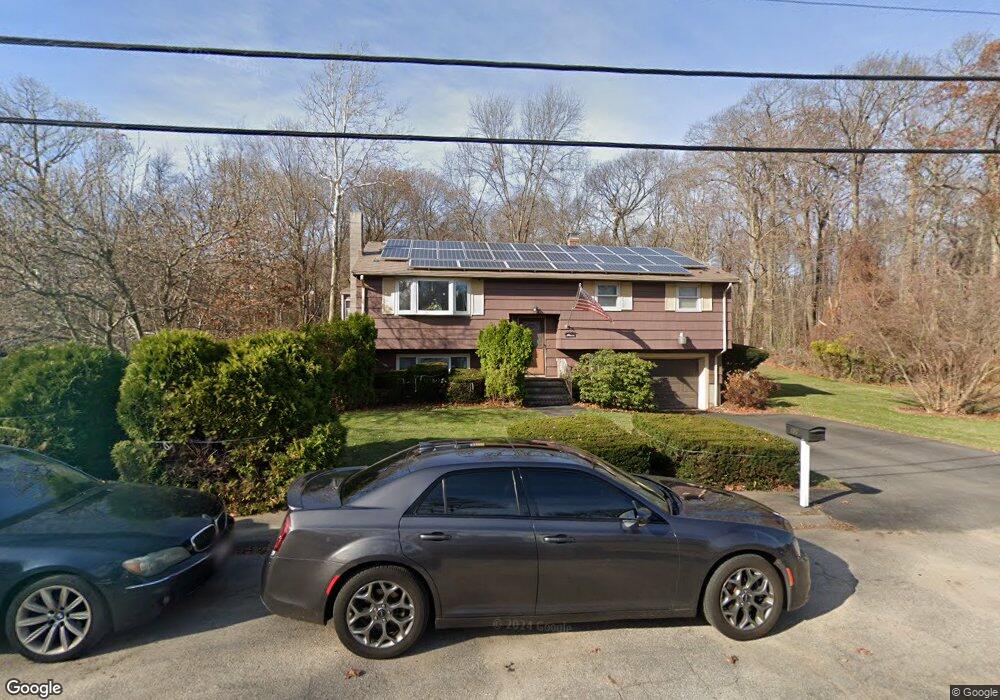
12 Lori Ln Randolph, MA 02368
South Randolph NeighborhoodEstimated Value: $498,000 - $623,296
3
Beds
2
Baths
1,342
Sq Ft
$425/Sq Ft
Est. Value
About This Home
This home is located at 12 Lori Ln, Randolph, MA 02368 and is currently estimated at $570,574, approximately $425 per square foot. 12 Lori Ln is a home located in Norfolk County with nearby schools including Randolph High School, Boston Higashi School, and Lighthouse Baptist Christian Academy.
Ownership History
Date
Name
Owned For
Owner Type
Purchase Details
Closed on
Jul 31, 1967
Bought by
Finer Stanley S and Finer Edythe F
Current Estimated Value
Create a Home Valuation Report for This Property
The Home Valuation Report is an in-depth analysis detailing your home's value as well as a comparison with similar homes in the area
Home Values in the Area
Average Home Value in this Area
Purchase History
| Date | Buyer | Sale Price | Title Company |
|---|---|---|---|
| Finer Stanley S | -- | -- |
Source: Public Records
Mortgage History
| Date | Status | Borrower | Loan Amount |
|---|---|---|---|
| Open | Finer Stanley S | $50,000 | |
| Closed | Finer Stanley S | $19,648 | |
| Open | Finer Stanley S | $136,000 |
Source: Public Records
Tax History
| Year | Tax Paid | Tax Assessment Tax Assessment Total Assessment is a certain percentage of the fair market value that is determined by local assessors to be the total taxable value of land and additions on the property. | Land | Improvement |
|---|---|---|---|---|
| 2025 | $6,070 | $522,800 | $244,100 | $278,700 |
| 2024 | $5,948 | $519,500 | $239,600 | $279,900 |
| 2023 | $5,635 | $466,500 | $217,700 | $248,800 |
| 2022 | $5,889 | $433,000 | $181,500 | $251,500 |
| 2021 | $5,656 | $382,700 | $151,200 | $231,500 |
| 2020 | $5,497 | $368,700 | $151,200 | $217,500 |
| 2019 | $5,415 | $361,500 | $144,000 | $217,500 |
| 2018 | $5,128 | $322,900 | $133,500 | $189,400 |
| 2017 | $4,862 | $300,500 | $127,000 | $173,500 |
| 2016 | $4,727 | $271,800 | $115,400 | $156,400 |
| 2015 | $4,626 | $255,600 | $110,000 | $145,600 |
Source: Public Records
Map
Nearby Homes
- 15 Hillsdale Rd
- 28 Mcdonnell Dr
- 23 Nightingale Cir
- 276 Center St
- 5 Patterson Ave E
- 20 Selwyn Rd
- 7 Van Beal Rd
- 327 Union St
- 0 Payson Ave
- 7 Oakwood Ave
- 14 Washington Cir
- 6 Eagle Rd
- 249 Mill St
- 217 Mill St
- 229 Mill St
- 71 Cole Terrace
- 747 S Main St
- 33 Hemlock Terrace
- 10 Alfred Terrace
- 54 Highland Glen Dr
Your Personal Tour Guide
Ask me questions while you tour the home.