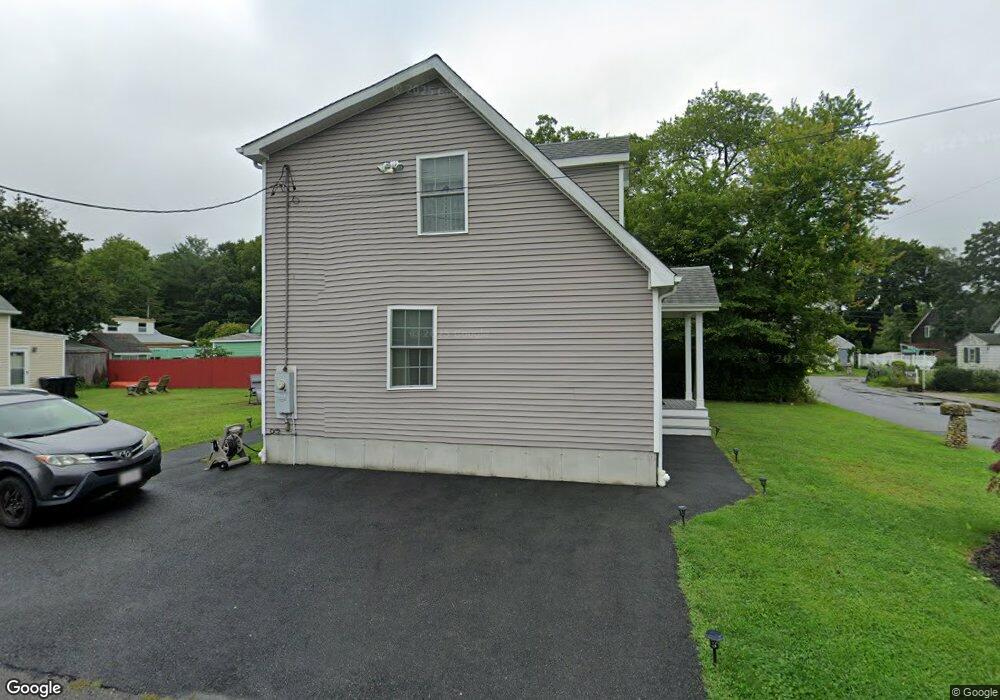
12 Maple St Dartmouth, MA 02747
Smith Mills NeighborhoodEstimated Value: $463,954 - $582,000
3
Beds
2
Baths
1,536
Sq Ft
$347/Sq Ft
Est. Value
About This Home
This home is located at 12 Maple St, Dartmouth, MA 02747 and is currently estimated at $533,489, approximately $347 per square foot. 12 Maple St is a home located in Bristol County with nearby schools including Dartmouth High School.
Ownership History
Date
Name
Owned For
Owner Type
Purchase Details
Closed on
Oct 17, 2011
Sold by
Novo Albert and Novo Carol
Bought by
Novo Albert and Novo Carol
Current Estimated Value
Home Financials for this Owner
Home Financials are based on the most recent Mortgage that was taken out on this home.
Original Mortgage
$180,000
Outstanding Balance
$117,010
Interest Rate
3%
Mortgage Type
Adjustable Rate Mortgage/ARM
Estimated Equity
$416,479
Purchase Details
Closed on
Sep 19, 2011
Sold by
Semass Financial Group
Bought by
Novo Albert and Novo Carol
Purchase Details
Closed on
Sep 16, 2011
Sold by
Crawley John P
Bought by
Semass Financial Group
Purchase Details
Closed on
Sep 28, 2009
Sold by
Pedersen Magne G
Bought by
Crawley John P
Home Financials for this Owner
Home Financials are based on the most recent Mortgage that was taken out on this home.
Original Mortgage
$190,000
Interest Rate
5.31%
Mortgage Type
Purchase Money Mortgage
Create a Home Valuation Report for This Property
The Home Valuation Report is an in-depth analysis detailing your home's value as well as a comparison with similar homes in the area
Home Values in the Area
Average Home Value in this Area
Purchase History
| Date | Buyer | Sale Price | Title Company |
|---|---|---|---|
| Novo Albert | -- | -- | |
| Novo Albert | -- | -- | |
| Novo Albert | $75,000 | -- | |
| Semass Financial Group | $190,000 | -- | |
| Crawley John P | $145,000 | -- |
Source: Public Records
Mortgage History
| Date | Status | Borrower | Loan Amount |
|---|---|---|---|
| Open | Novo Albert | $180,000 | |
| Previous Owner | Crawley John P | $190,000 |
Source: Public Records
Tax History Compared to Growth
Tax History
| Year | Tax Paid | Tax Assessment Tax Assessment Total Assessment is a certain percentage of the fair market value that is determined by local assessors to be the total taxable value of land and additions on the property. | Land | Improvement |
|---|---|---|---|---|
| 2025 | $3,492 | $385,900 | $115,000 | $270,900 |
| 2024 | $3,453 | $377,800 | $115,000 | $262,800 |
| 2023 | $3,456 | $356,700 | $115,000 | $241,700 |
| 2022 | $3,343 | $322,700 | $115,000 | $207,700 |
| 2021 | $3,611 | $333,400 | $128,400 | $205,000 |
| 2020 | $3,421 | $314,400 | $127,100 | $187,300 |
| 2019 | $3,151 | $290,400 | $106,100 | $184,300 |
| 2018 | $2,822 | $265,700 | $108,300 | $157,400 |
| 2017 | $2,387 | $224,300 | $84,300 | $140,000 |
| 2016 | $2,376 | $224,600 | $86,400 | $138,200 |
| 2015 | $2,265 | $215,500 | $75,800 | $139,700 |
| 2014 | $2,214 | $212,100 | $76,000 | $136,100 |
Source: Public Records
Map
Nearby Homes
- 21 Evergreen St
- 55 Lakeside Ave
- 818 Reed Rd
- 735 Reed Rd
- 565 Highland Ave
- 29 Union Ave
- 461 Reed Rd
- 96 Forge Rd
- 3 Roller Coaster Way Unit Lot 1
- 15 S Breault St
- 19 Charles Joseph Dr
- 2 Donna Marie Dr
- 27 Dias Ave
- 1276 Old Fall River Rd
- Block 30 Hixville Rd
- Block 27 Hixville Rd
- 496-L62M40 Hixville Rd
- 00 Hixville Rd
- Block 14 Hixville Rd
- 9 Kyle Jacob Rd