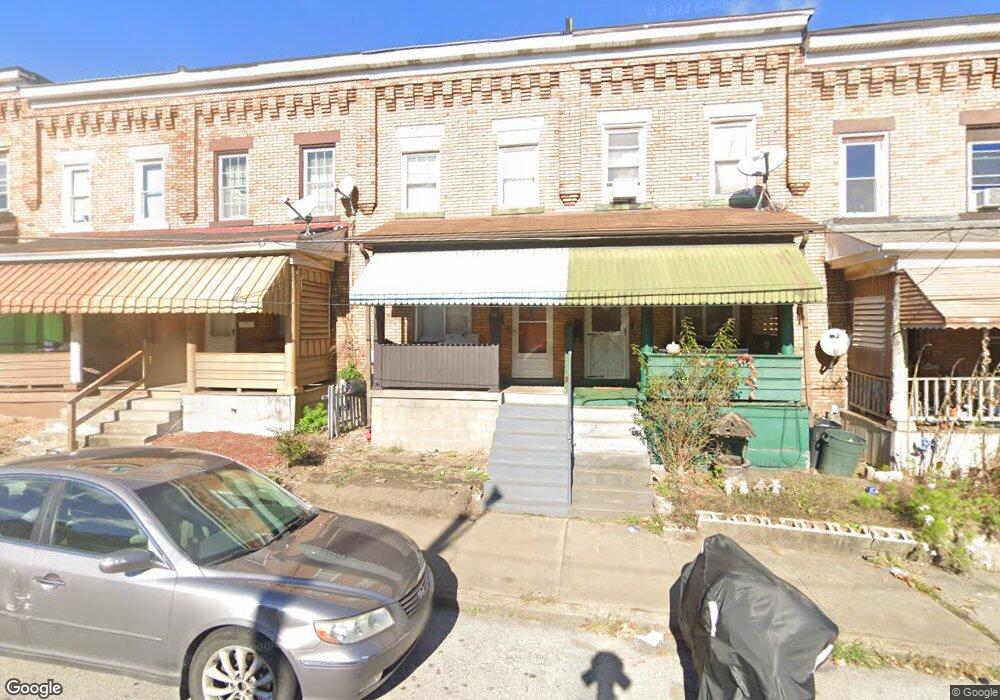
12 Maple St East Pittsburgh, PA 15112
Estimated Value: $46,000 - $71,000
3
Beds
2
Baths
1,498
Sq Ft
$39/Sq Ft
Est. Value
About This Home
This home is located at 12 Maple St, East Pittsburgh, PA 15112 and is currently estimated at $57,919, approximately $38 per square foot. 12 Maple St is a home located in Allegheny County with nearby schools including Woodland Hills Senior High School, Braddock Hills High School, and Propel Cs-East.
Ownership History
Date
Name
Owned For
Owner Type
Purchase Details
Closed on
Mar 11, 2013
Sold by
Bordogna Angelo J
Bought by
Lilac Investments Llc
Current Estimated Value
Home Financials for this Owner
Home Financials are based on the most recent Mortgage that was taken out on this home.
Original Mortgage
$50,000
Outstanding Balance
$35,284
Interest Rate
3.54%
Mortgage Type
New Conventional
Estimated Equity
$22,635
Purchase Details
Closed on
Jul 5, 1977
Bought by
Bordogna Angelo J and Bordogna Joylene L
Create a Home Valuation Report for This Property
The Home Valuation Report is an in-depth analysis detailing your home's value as well as a comparison with similar homes in the area
Home Values in the Area
Average Home Value in this Area
Purchase History
| Date | Buyer | Sale Price | Title Company |
|---|---|---|---|
| Lilac Investments Llc | $11,000 | -- | |
| Bordogna Angelo J | -- | -- |
Source: Public Records
Mortgage History
| Date | Status | Borrower | Loan Amount |
|---|---|---|---|
| Open | Lilac Investments Llc | $50,000 |
Source: Public Records
Tax History
| Year | Tax Paid | Tax Assessment Tax Assessment Total Assessment is a certain percentage of the fair market value that is determined by local assessors to be the total taxable value of land and additions on the property. | Land | Improvement |
|---|---|---|---|---|
| 2025 | $751 | $16,800 | $1,400 | $15,400 |
| 2024 | $751 | $16,800 | $1,400 | $15,400 |
| 2023 | $759 | $16,800 | $1,400 | $15,400 |
| 2022 | $759 | $16,800 | $1,400 | $15,400 |
| 2021 | $691 | $16,800 | $1,400 | $15,400 |
| 2020 | $744 | $16,800 | $1,400 | $15,400 |
| 2019 | $731 | $16,800 | $1,400 | $15,400 |
| 2017 | $731 | $16,800 | $1,400 | $15,400 |
Source: Public Records
Map
Nearby Homes
- 534 Howard St
- 609-611 Grandview Ave
- 507 Center St
- 405 Howard St Unit C4
- 521 Bessemer Ave
- 1630 Poplar Ave
- 328 Center St
- 1515 Terrace St
- 312 Howard St
- 0 Glosser St Unit 1712886
- 1611 Ridge Ave
- 1604 Ridge Ave
- 0 Ridge Ave
- 110 Center St
- 1534 Grant St
- 1515 Ridge Ave
- 1438-1440 Grandview Ave
- 1421 Ridge Ave
- 1306 Brinton Ave
- 150 North Ave
Your Personal Tour Guide
Ask me questions while you tour the home.