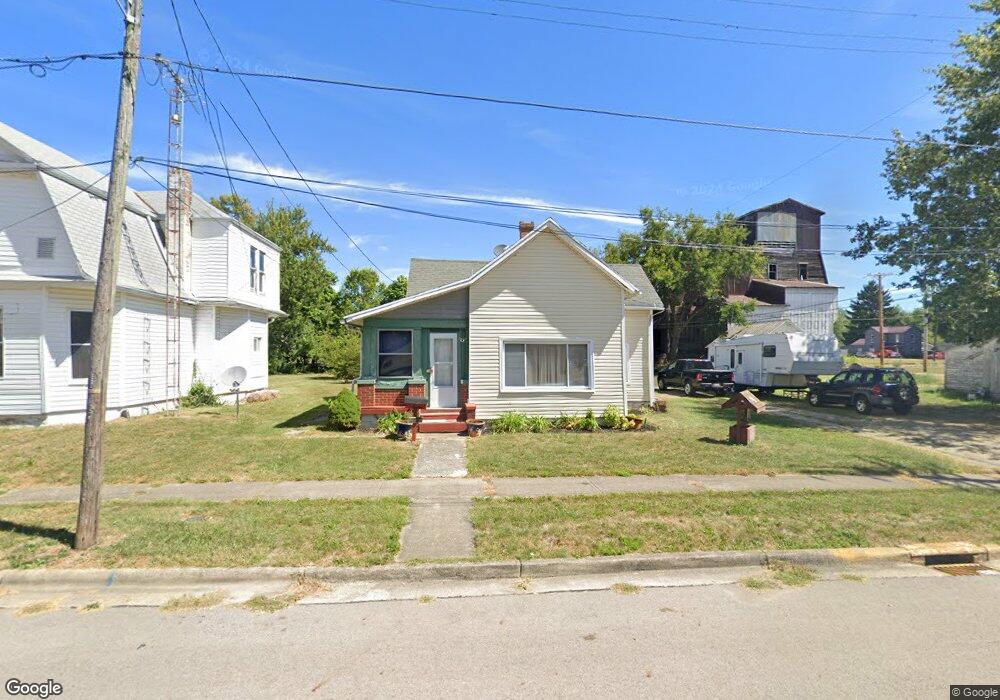
12 Maple St Jeffersonville, OH 43128
Estimated Value: $110,370 - $131,000
3
Beds
1
Bath
1,152
Sq Ft
$104/Sq Ft
Est. Value
About This Home
This home is located at 12 Maple St, Jeffersonville, OH 43128 and is currently estimated at $119,593, approximately $103 per square foot. 12 Maple St is a home located in Fayette County with nearby schools including Miami Trace Elementary School, Miami Trace Middle School, and Miami Trace High School.
Ownership History
Date
Name
Owned For
Owner Type
Purchase Details
Closed on
Feb 28, 2007
Sold by
Perry John and Perry Teresa
Bought by
Perry & Ging Investments Llc
Current Estimated Value
Purchase Details
Closed on
Mar 7, 2006
Sold by
Deutsche Bank National Trust Co
Bought by
Perry John and Perry Teresa
Purchase Details
Closed on
Jul 25, 2005
Sold by
Williams Mary M
Bought by
Deutsche Bank National Trust Co
Purchase Details
Closed on
Jun 14, 1996
Sold by
Cline Raymond J
Bought by
Cline Rickey and Williams Mary
Home Financials for this Owner
Home Financials are based on the most recent Mortgage that was taken out on this home.
Original Mortgage
$24,000
Interest Rate
13.75%
Mortgage Type
New Conventional
Purchase Details
Closed on
Jul 15, 1992
Bought by
Perry & Ging Investments Llc
Purchase Details
Closed on
Oct 15, 1991
Bought by
Perry & Ging Investments Llc
Create a Home Valuation Report for This Property
The Home Valuation Report is an in-depth analysis detailing your home's value as well as a comparison with similar homes in the area
Home Values in the Area
Average Home Value in this Area
Purchase History
| Date | Buyer | Sale Price | Title Company |
|---|---|---|---|
| Perry & Ging Investments Llc | -- | Attorney | |
| Perry John | $23,000 | Sovereign Title Agency Llc | |
| Deutsche Bank National Trust Co | $26,000 | -- | |
| Cline Rickey | $24,000 | -- | |
| Perry & Ging Investments Llc | $28,400 | -- | |
| Perry & Ging Investments Llc | $21,000 | -- |
Source: Public Records
Mortgage History
| Date | Status | Borrower | Loan Amount |
|---|---|---|---|
| Previous Owner | Cline Rickey | $24,000 |
Source: Public Records
Tax History Compared to Growth
Tax History
| Year | Tax Paid | Tax Assessment Tax Assessment Total Assessment is a certain percentage of the fair market value that is determined by local assessors to be the total taxable value of land and additions on the property. | Land | Improvement |
|---|---|---|---|---|
| 2024 | $1,095 | $24,820 | $6,620 | $18,200 |
| 2023 | $1,095 | $16,770 | $5,110 | $11,660 |
| 2022 | $847 | $16,450 | $5,110 | $11,340 |
| 2021 | $822 | $16,450 | $5,110 | $11,340 |
| 2020 | $718 | $13,870 | $4,450 | $9,420 |
| 2019 | $719 | $13,870 | $4,450 | $9,420 |
| 2018 | $614 | $13,870 | $4,450 | $9,420 |
| 2017 | $500 | $11,590 | $4,450 | $7,140 |
| 2016 | $500 | $11,590 | $4,450 | $7,140 |
| 2015 | $527 | $0 | $0 | $0 |
| 2013 | $534 | $11,585 | $4,445 | $7,140 |
| 2012 | -- | $33,100 | $0 | $0 |
Source: Public Records
Map
Nearby Homes