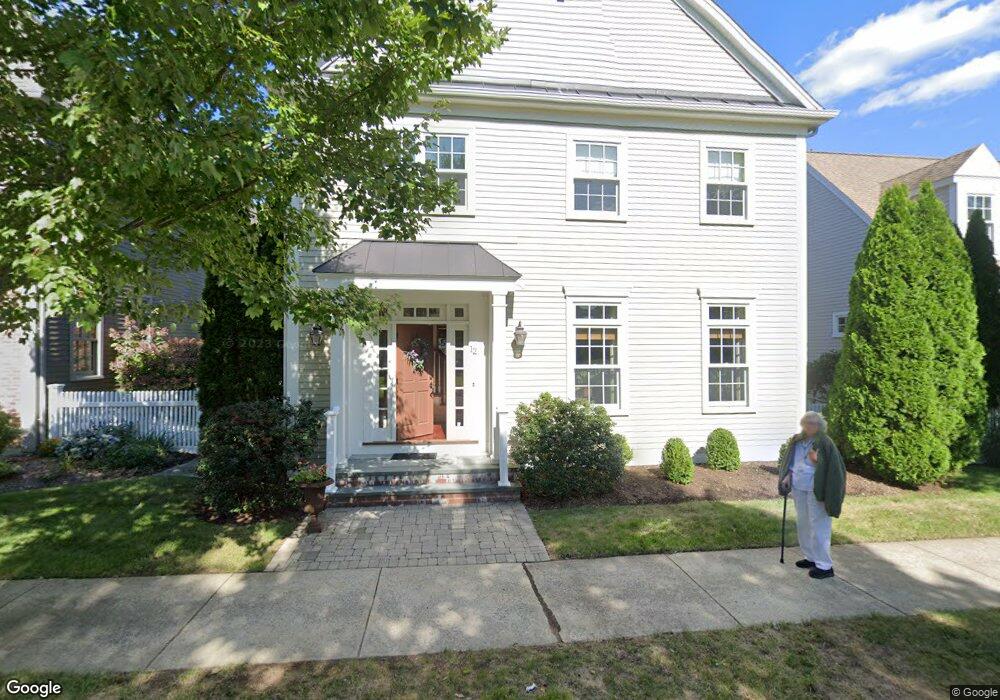
12 Maple St Medfield, MA 02052
Estimated Value: $1,334,948 - $1,652,000
3
Beds
4
Baths
2,908
Sq Ft
$492/Sq Ft
Est. Value
About This Home
This home is located at 12 Maple St, Medfield, MA 02052 and is currently estimated at $1,431,237, approximately $492 per square foot. 12 Maple St is a home located in Norfolk County with nearby schools including Ralph Wheelock School, Memorial School, and Dale Street School.
Ownership History
Date
Name
Owned For
Owner Type
Purchase Details
Closed on
Jan 16, 2023
Sold by
Gifford Anisia A
Bought by
Anisia A Gifford T A and Anisia Gifford
Current Estimated Value
Purchase Details
Closed on
Nov 19, 2019
Sold by
Ricegifford Rt and Rice
Bought by
Gifford Anisia R
Purchase Details
Closed on
Aug 8, 2013
Sold by
Rice Alan and Gifford Anisia A
Bought by
Rice Gifford Rt and Rice
Purchase Details
Closed on
Nov 26, 2008
Sold by
Olde Village Square Co
Bought by
Gifford Anisia A and Gifford George H
Home Financials for this Owner
Home Financials are based on the most recent Mortgage that was taken out on this home.
Original Mortgage
$688,000
Interest Rate
6.47%
Mortgage Type
Purchase Money Mortgage
Create a Home Valuation Report for This Property
The Home Valuation Report is an in-depth analysis detailing your home's value as well as a comparison with similar homes in the area
Home Values in the Area
Average Home Value in this Area
Purchase History
| Date | Buyer | Sale Price | Title Company |
|---|---|---|---|
| Anisia A Gifford T A | -- | None Available | |
| Anisia A Gifford T A | -- | None Available | |
| Gifford Anisia R | -- | -- | |
| Gifford Anisia R | -- | -- | |
| Rice Gifford Rt | -- | -- | |
| Rice Gifford Rt | -- | -- | |
| Gifford Anisia A | $860,788 | -- | |
| Gifford Anisia A | $860,788 | -- |
Source: Public Records
Mortgage History
| Date | Status | Borrower | Loan Amount |
|---|---|---|---|
| Previous Owner | Gifford Anisia A | $250,000 | |
| Previous Owner | Gifford Anisia A | $688,000 |
Source: Public Records
Tax History
| Year | Tax Paid | Tax Assessment Tax Assessment Total Assessment is a certain percentage of the fair market value that is determined by local assessors to be the total taxable value of land and additions on the property. | Land | Improvement |
|---|---|---|---|---|
| 2025 | $15,677 | $1,136,000 | $0 | $1,136,000 |
| 2024 | $15,848 | $1,082,500 | $0 | $1,082,500 |
| 2023 | $16,350 | $1,059,600 | $0 | $1,059,600 |
| 2022 | $17,065 | $979,600 | $0 | $979,600 |
| 2021 | $17,183 | $967,500 | $0 | $967,500 |
| 2020 | $17,251 | $967,500 | $0 | $967,500 |
| 2019 | $17,246 | $965,100 | $0 | $965,100 |
| 2018 | $16,844 | $989,100 | $0 | $989,100 |
| 2017 | $16,706 | $989,100 | $0 | $989,100 |
| 2016 | $16,567 | $989,100 | $0 | $989,100 |
| 2015 | $15,331 | $955,800 | $0 | $955,800 |
| 2014 | $15,095 | $936,400 | $0 | $936,400 |
Source: Public Records
Map
Nearby Homes
Your Personal Tour Guide
Ask me questions while you tour the home.