Estimated Value: $253,000 - $291,630
3
Beds
2
Baths
1,562
Sq Ft
$172/Sq Ft
Est. Value
About This Home
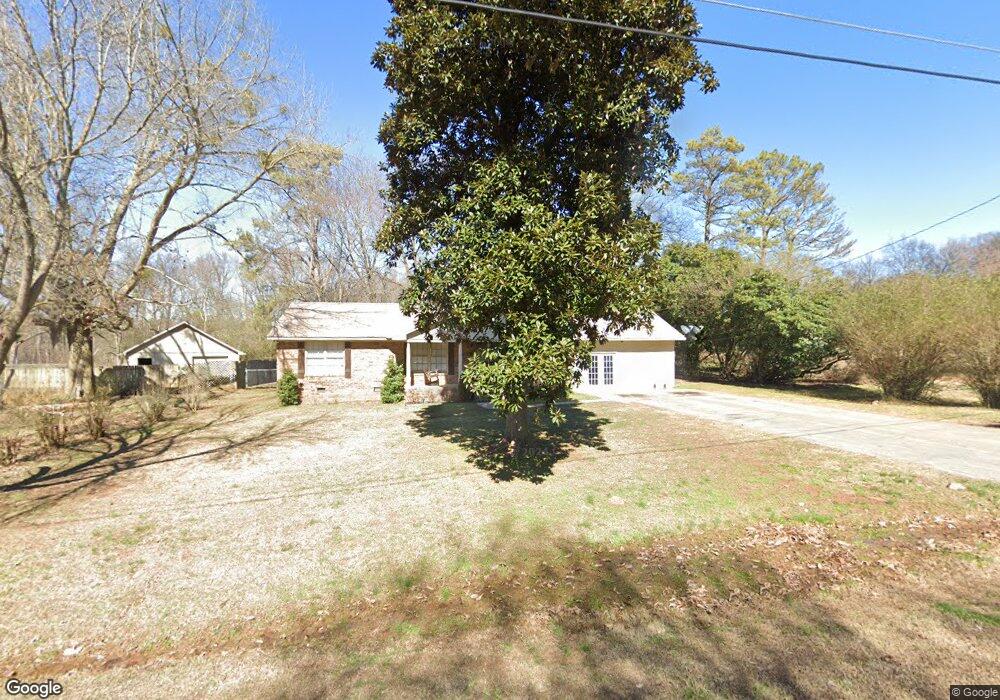
This home is located at 12 Marlynn Dr NE, Rome, GA 30161 and is currently estimated at $268,658, approximately $171 per square foot. 12 Marlynn Dr NE is a home located in Floyd County with nearby schools including Model Middle School, Model High School, and Unity Christian School.
Ownership History
Date
Name
Owned For
Owner Type
Purchase Details
Closed on
Nov 22, 2019
Sold by
Disalvo Micah
Bought by
Reyes Eustacio
Current Estimated Value
Purchase Details
Closed on
Sep 1, 2017
Sold by
Lashley Helen
Bought by
Disalvo Micah
Purchase Details
Closed on
Aug 19, 2017
Sold by
Morrison Jeffrey G
Bought by
Ashley Helen Jeanette
Purchase Details
Closed on
Oct 30, 2003
Sold by
Morrison Helen Lashley and Morri Jeffrey G
Bought by
Morrison Helen Lashley
Purchase Details
Closed on
Jul 25, 1995
Sold by
Lashley Helen J
Bought by
Morrison Helen Lashley and Morrison Jeffrey G
Purchase Details
Closed on
Apr 18, 1988
Sold by
Lashley Robert R and Lashley Helen J
Bought by
Lashley Helen J
Purchase Details
Closed on
Nov 21, 1975
Sold by
Atkins Hazel W
Bought by
Lashley Robert R and Lashley Helen J
Purchase Details
Closed on
Dec 23, 1974
Sold by
Hall John Wayne and Hamilton Jack V
Bought by
Atkins Hazel W
Purchase Details
Closed on
Dec 15, 1970
Bought by
P and R
Purchase Details
Closed on
Jun 4, 1968
Bought by
Hall John Wayne and Hamilton Jack V
Create a Home Valuation Report for This Property
The Home Valuation Report is an in-depth analysis detailing your home's value as well as a comparison with similar homes in the area
Home Values in the Area
Average Home Value in this Area
Purchase History
| Date | Buyer | Sale Price | Title Company |
|---|---|---|---|
| Reyes Eustacio | $134,000 | -- | |
| Disalvo Micah | -- | -- | |
| Ashley Helen Jeanette | -- | -- | |
| Morrison Helen Lashley | -- | -- | |
| Morrison Helen Lashley | -- | -- | |
| Lashley Helen J | -- | -- | |
| Lashley Robert R | $35,200 | -- | |
| Atkins Hazel W | $30,000 | -- | |
| P | -- | -- | |
| Hall John Wayne | -- | -- |
Source: Public Records
Tax History Compared to Growth
Tax History
| Year | Tax Paid | Tax Assessment Tax Assessment Total Assessment is a certain percentage of the fair market value that is determined by local assessors to be the total taxable value of land and additions on the property. | Land | Improvement |
|---|---|---|---|---|
| 2024 | $2,873 | $103,559 | $11,232 | $92,327 |
| 2023 | $3,026 | $99,450 | $9,984 | $89,466 |
| 2022 | $2,529 | $83,069 | $8,320 | $74,749 |
| 2021 | $1,720 | $54,926 | $8,320 | $46,606 |
| 2020 | $1,603 | $50,720 | $6,240 | $44,480 |
| 2019 | $1,077 | $34,030 | $6,240 | $27,790 |
| 2018 | $1,042 | $32,867 | $6,240 | $26,627 |
| 2017 | $422 | $32,331 | $6,240 | $26,091 |
| 2016 | $425 | $32,065 | $6,240 | $25,825 |
| 2015 | $403 | $32,065 | $6,240 | $25,825 |
| 2014 | $403 | $32,065 | $6,240 | $25,825 |
Source: Public Records
Map
Nearby Homes
- 18 Marlynn Dr NE
- 3349 Calhoun Rd NE
- 445 2nd Shannon St
- 489 Barron Rd NE
- 35 Old Shannon Rd NE
- 195 Shannon Rd NE
- 6 Keystone Ln NE
- 21 Fernwood Way NE
- 13 Granite Way NE
- 29 Woodcliffe Dr NE
- 12 Round Rock Cir NE
- 1055 E Hermitage Rd NE
- 320 Old Shannon Rd NE
- 58 Round Rock Cir NE
- 24 Woodcliffe Dr NE
- 4th Shannon Cir NE
- 3 NE Page Dr
- 107 Whispering Pines NE
- 105 Whispering Pines NE
- 14 Marlynn Dr NE
- 8 Marlynn Dr NE
- 8 Marlynn Dr NE
- 8 Marlynn Dr NE
- 8 Marlynn Dr NE Unit 7
- 9 Marlynn Dr NE
- 16 Marlynn Dr NE
- 7 Marlynn Dr NE
- 0 Marlynn Dr NE Unit 8610635
- 0 Marlynn Dr NE Unit 8247448
- 0 Marlynn Dr NE Unit 7065639
- 5 Marlynn Dr NE
- 13 Marlynn Dr NE
- 4 Marlynn Dr NE
- 6 Iracen Ct NE
- 0 Edgedale Ct NE Unit 7034289
- 0 Edgedale Ct NE
- 4 Edgedale Ct NE
- 20 Marlynn Dr NE
- 3 Marlynn Dr NE