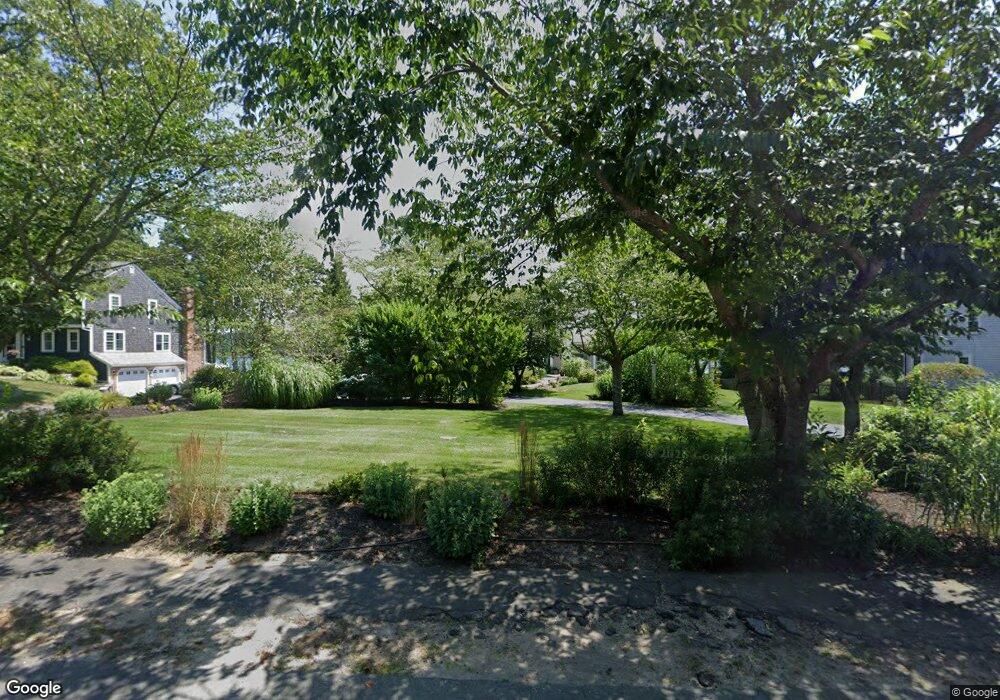
12 Marscot Way Plymouth, MA 02360
Estimated Value: $783,000 - $960,000
4
Beds
3
Baths
3,960
Sq Ft
$225/Sq Ft
Est. Value
About This Home
This home is located at 12 Marscot Way, Plymouth, MA 02360 and is currently estimated at $889,301, approximately $224 per square foot. 12 Marscot Way is a home located in Plymouth County with nearby schools including Federal Furnace Elementary School, Plymouth Community Intermediate, and Plymouth North High School.
Ownership History
Date
Name
Owned For
Owner Type
Purchase Details
Closed on
Jul 21, 2006
Sold by
Jennifer L Hanlon T L and Jennifer Hanlon
Bought by
Neil Robert J and Neil Patricia M
Current Estimated Value
Purchase Details
Closed on
Oct 16, 2003
Sold by
Hanlon Jennifer L
Bought by
Hanlon Jennifer L and Hanlon Jennifer L
Purchase Details
Closed on
Jan 15, 1987
Sold by
Hanlon David M
Bought by
Hanlon Family R T
Purchase Details
Closed on
Jan 13, 1987
Sold by
Hanlon Ft
Bought by
Hanlon David M
Create a Home Valuation Report for This Property
The Home Valuation Report is an in-depth analysis detailing your home's value as well as a comparison with similar homes in the area
Home Values in the Area
Average Home Value in this Area
Purchase History
| Date | Buyer | Sale Price | Title Company |
|---|---|---|---|
| Neil Robert J | $400,000 | -- | |
| Hanlon Jennifer L | -- | -- | |
| Hanlon Family R T | $190,000 | -- | |
| Hanlon David M | $65,000 | -- |
Source: Public Records
Mortgage History
| Date | Status | Borrower | Loan Amount |
|---|---|---|---|
| Open | Hanlon David M | $530,166 | |
| Closed | Hanlon David M | $531,606 |
Source: Public Records
Tax History Compared to Growth
Tax History
| Year | Tax Paid | Tax Assessment Tax Assessment Total Assessment is a certain percentage of the fair market value that is determined by local assessors to be the total taxable value of land and additions on the property. | Land | Improvement |
|---|---|---|---|---|
| 2025 | $9,860 | $777,000 | $286,200 | $490,800 |
| 2024 | $9,479 | $736,500 | $271,800 | $464,700 |
| 2023 | $9,350 | $682,000 | $247,800 | $434,200 |
| 2022 | $9,190 | $595,600 | $223,600 | $372,000 |
| 2021 | $9,161 | $566,900 | $223,600 | $343,300 |
| 2020 | $8,975 | $548,900 | $211,600 | $337,300 |
| 2019 | $8,688 | $525,300 | $187,600 | $337,700 |
| 2018 | $8,457 | $513,800 | $175,600 | $338,200 |
| 2017 | $8,293 | $500,200 | $175,600 | $324,600 |
| 2016 | $8,080 | $496,600 | $169,600 | $327,000 |
| 2015 | $7,672 | $493,700 | $163,600 | $330,100 |
| 2014 | $7,035 | $465,000 | $163,600 | $301,400 |
Source: Public Records
Map
Nearby Homes