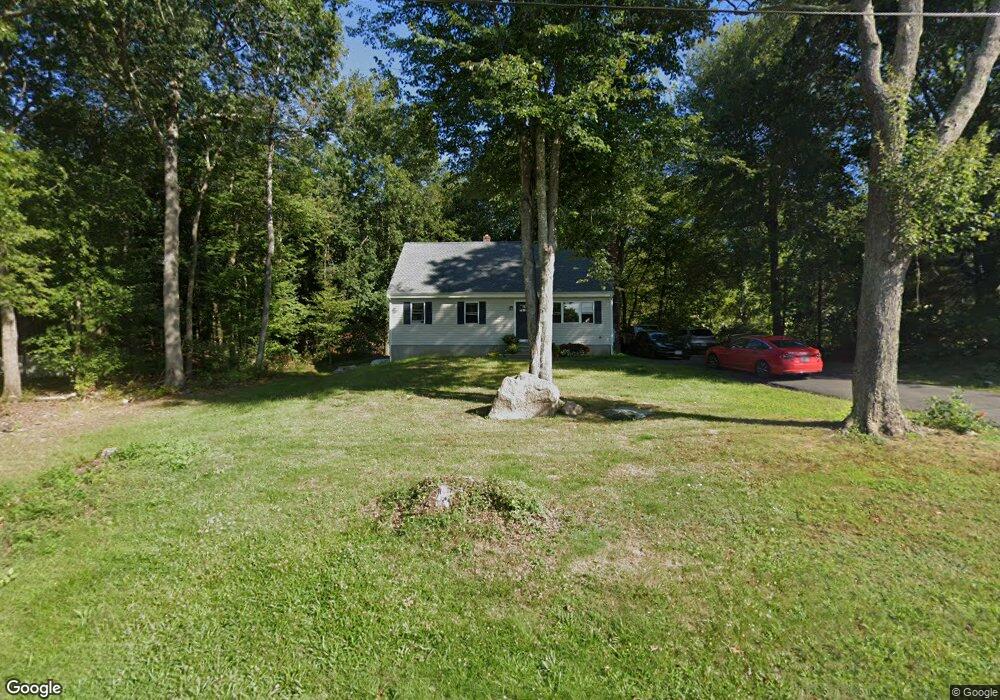
12 Martin Dr Assonet, MA 02702
Estimated Value: $538,025 - $730,000
3
Beds
2
Baths
1,680
Sq Ft
$360/Sq Ft
Est. Value
About This Home
This home is located at 12 Martin Dr, Assonet, MA 02702 and is currently estimated at $604,006, approximately $359 per square foot. 12 Martin Dr is a home located in Bristol County with nearby schools including Freetown Elementary School, George R Austin Intermediate School, and Freetown-Lakeville Middle School.
Ownership History
Date
Name
Owned For
Owner Type
Purchase Details
Closed on
Jan 12, 2021
Sold by
Courcier Mary B
Bought by
Courcier Mary B and Courcier Evan
Current Estimated Value
Purchase Details
Closed on
Mar 2, 2007
Sold by
Courcier John J and Courcier Mary Beth
Bought by
Courcier Mary Beth
Purchase Details
Closed on
Oct 4, 2002
Sold by
Long Realty Inc
Bought by
Faria John W and Faria Terri A
Home Financials for this Owner
Home Financials are based on the most recent Mortgage that was taken out on this home.
Original Mortgage
$263,100
Interest Rate
6.27%
Mortgage Type
Purchase Money Mortgage
Create a Home Valuation Report for This Property
The Home Valuation Report is an in-depth analysis detailing your home's value as well as a comparison with similar homes in the area
Purchase History
| Date | Buyer | Sale Price | Title Company |
|---|---|---|---|
| Courcier Mary B | -- | None Available | |
| Courcier Mary Beth | -- | -- | |
| Faria John W | $346,420 | -- |
Source: Public Records
Mortgage History
| Date | Status | Borrower | Loan Amount |
|---|---|---|---|
| Previous Owner | Faria John W | $263,100 |
Source: Public Records
Tax History
| Year | Tax Paid | Tax Assessment Tax Assessment Total Assessment is a certain percentage of the fair market value that is determined by local assessors to be the total taxable value of land and additions on the property. | Land | Improvement |
|---|---|---|---|---|
| 2025 | $4,627 | $466,900 | $181,600 | $285,300 |
| 2024 | $4,597 | $440,700 | $171,300 | $269,400 |
| 2023 | $4,272 | $398,900 | $154,200 | $244,700 |
| 2022 | $4,073 | $337,700 | $130,700 | $207,000 |
| 2021 | $3,804 | $299,500 | $118,800 | $180,700 |
| 2020 | $3,780 | $290,300 | $114,300 | $176,000 |
| 2019 | $3,573 | $271,700 | $108,800 | $162,900 |
| 2018 | $3,389 | $254,600 | $108,800 | $145,800 |
| 2017 | $3,326 | $249,700 | $108,800 | $140,900 |
| 2016 | $3,235 | $247,100 | $105,700 | $141,400 |
| 2015 | $3,151 | $244,300 | $105,700 | $138,600 |
| 2014 | $3,019 | $239,400 | $103,500 | $135,900 |
Source: Public Records
Map
Nearby Homes
- 24 Bells Brook Rd
- 71 County St
- 145 County St
- 0 Chace Rd Unit 73481572
- 0 Sammys Ln
- 37 Simpson Ln
- 1 Freetown St
- 92 Chace Rd
- 5 Hadley Heights Way
- 16 Water St Unit C
- 16 Water St Unit A
- 16 Water St Unit B
- 16 Water St Unit D
- 42 High St
- 23 Elmwood Dr
- 00 Island Rd
- 14 Spruce Rd
- 23 5th Ave
- 12 3rd Ave
- 14 2nd Ave
Your Personal Tour Guide
Ask me questions while you tour the home.