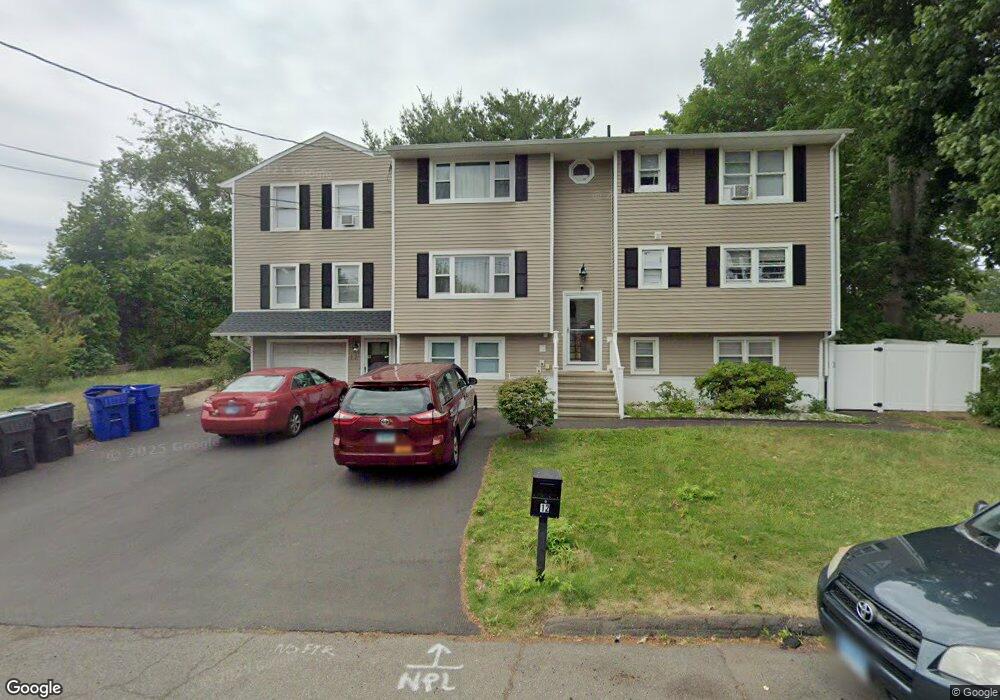
12 Michael St East Haven, CT 06513
Estimated Value: $559,462
7
Beds
3
Baths
2,850
Sq Ft
$196/Sq Ft
Est. Value
About This Home
This home is located at 12 Michael St, East Haven, CT 06513 and is currently estimated at $559,462, approximately $196 per square foot. 12 Michael St is a home located in New Haven County with nearby schools including East Haven High School and All Nations Christian Academy.
Ownership History
Date
Name
Owned For
Owner Type
Purchase Details
Closed on
Nov 7, 2013
Sold by
Continuum Of Care Inc
Bought by
Continuum Management C
Current Estimated Value
Purchase Details
Closed on
Apr 15, 2011
Sold by
Torres Francisco and Torres Gladys
Bought by
Continuum Of Care
Home Financials for this Owner
Home Financials are based on the most recent Mortgage that was taken out on this home.
Original Mortgage
$256,500
Interest Rate
4.89%
Mortgage Type
Commercial
Purchase Details
Closed on
Jul 2, 2003
Sold by
Nastri Joseph A and Nastri Diana L
Bought by
Torres Francisco and Torres Gladys
Purchase Details
Closed on
Sep 25, 2001
Sold by
Brady Susan M
Bought by
Nastri Joseph A and Nastri Diana L
Create a Home Valuation Report for This Property
The Home Valuation Report is an in-depth analysis detailing your home's value as well as a comparison with similar homes in the area
Home Values in the Area
Average Home Value in this Area
Purchase History
| Date | Buyer | Sale Price | Title Company |
|---|---|---|---|
| Continuum Management C | -- | -- | |
| Continuum Management C | -- | -- | |
| Continuum Of Care | $285,000 | -- | |
| Continuum Of Care | $285,000 | -- | |
| Torres Francisco | $320,000 | -- | |
| Torres Francisco | $320,000 | -- | |
| Nastri Joseph A | $189,000 | -- | |
| Nastri Joseph A | $189,000 | -- |
Source: Public Records
Mortgage History
| Date | Status | Borrower | Loan Amount |
|---|---|---|---|
| Previous Owner | Nastri Joseph A | $256,500 |
Source: Public Records
Tax History Compared to Growth
Tax History
| Year | Tax Paid | Tax Assessment Tax Assessment Total Assessment is a certain percentage of the fair market value that is determined by local assessors to be the total taxable value of land and additions on the property. | Land | Improvement |
|---|---|---|---|---|
| 2025 | $10,180 | $304,430 | $42,280 | $262,150 |
| 2024 | $10,180 | $304,430 | $42,280 | $262,150 |
| 2023 | $9,498 | $304,430 | $42,280 | $262,150 |
| 2022 | $9,498 | $304,430 | $42,280 | $262,150 |
| 2021 | $10,095 | $294,750 | $35,210 | $259,540 |
| 2020 | $10,095 | $294,750 | $35,210 | $259,540 |
| 2019 | $9,533 | $294,040 | $35,210 | $258,830 |
| 2018 | $9,542 | $294,040 | $35,210 | $258,830 |
| 2017 | $9,277 | $294,040 | $35,210 | $258,830 |
| 2016 | $7,928 | $251,280 | $38,730 | $212,550 |
| 2015 | $7,928 | $251,280 | $38,730 | $212,550 |
| 2014 | $8,054 | $251,280 | $38,730 | $212,550 |
Source: Public Records
Map
Nearby Homes
- 9 Dell Dr
- 66 John St
- 173 Russo Ave Unit 610
- 173 Russo Ave Unit 409
- 1423 Quinnipiac Ave Unit 115
- 1423 Quinnipiac Ave Unit 709
- 1423 Quinnipiac Ave Unit 602
- 1423 Quinnipiac Ave Unit 707
- 1423 Quinnipiac Ave Unit 508
- 1423 Quinnipiac Ave Unit 103
- 1423 Quinnipiac Ave Unit 108
- 1423 Quinnipiac Ave Unit 808
- 1445 Quinnipiac Ave
- 242 Barnes Ave
- 1190 Quinnipiac Ave
- 131 Allison Way
- 15 Donna Dr Unit A1
- 40 Donna Dr Unit C2
- 140 Thompson St Unit 16E
- 140 Thompson St Unit 14A