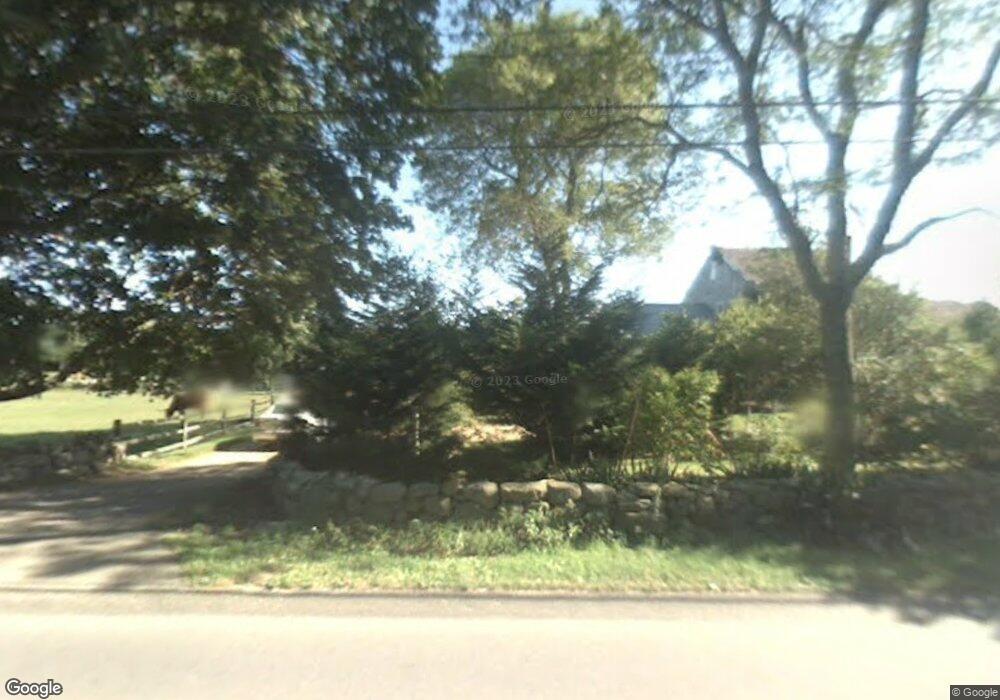
12 Middle Rd Chilmark, MA 02535
Chilmark NeighborhoodEstimated Value: $2,961,000 - $3,739,000
6
Beds
6
Baths
3,778
Sq Ft
$867/Sq Ft
Est. Value
About This Home
This home is located at 12 Middle Rd, Chilmark, MA 02535 and is currently estimated at $3,273,761, approximately $866 per square foot. 12 Middle Rd is a home located in Dukes County with nearby schools including Martha's Vineyard Regional High School and Martha's Vineyard Charter School.
Ownership History
Date
Name
Owned For
Owner Type
Purchase Details
Closed on
Dec 10, 2024
Sold by
Mark Gimbel T and Mark Gimbel
Bought by
Brookside Chilmark Llc
Current Estimated Value
Purchase Details
Closed on
Aug 31, 2022
Sold by
S Liebhafsky T D
Bought by
Mark Gimbel T and Mark Gimbel
Purchase Details
Closed on
May 7, 2010
Sold by
Gimbel Wendy R
Bought by
Wendy R Gimbel Chilmar R and Wendy Gimbel
Create a Home Valuation Report for This Property
The Home Valuation Report is an in-depth analysis detailing your home's value as well as a comparison with similar homes in the area
Home Values in the Area
Average Home Value in this Area
Purchase History
| Date | Buyer | Sale Price | Title Company |
|---|---|---|---|
| Brookside Chilmark Llc | -- | None Available | |
| Brookside Chilmark Llc | -- | None Available | |
| Mark Gimbel T | -- | None Available | |
| Mark Gimbel T | -- | None Available | |
| Mark Gimbel T | -- | None Available | |
| Wendy R Gimbel Chilmar R | -- | -- | |
| Douglas S Liebhafsky C S | -- | -- | |
| Douglas S Liebhafsky C S | -- | -- |
Source: Public Records
Tax History
| Year | Tax Paid | Tax Assessment Tax Assessment Total Assessment is a certain percentage of the fair market value that is determined by local assessors to be the total taxable value of land and additions on the property. | Land | Improvement |
|---|---|---|---|---|
| 2025 | $5,336 | $2,371,600 | $1,133,500 | $1,238,100 |
| 2024 | $4,858 | $2,291,400 | $1,108,800 | $1,182,600 |
| 2023 | $4,694 | $1,784,700 | $852,900 | $931,800 |
| 2022 | $3,974 | $1,409,300 | $631,800 | $777,500 |
| 2021 | $3,931 | $1,351,000 | $631,800 | $719,200 |
| 2020 | $3,814 | $1,333,600 | $619,400 | $714,200 |
| 2019 | $3,720 | $1,291,600 | $619,400 | $672,200 |
| 2018 | $3,552 | $1,291,600 | $619,400 | $672,200 |
| 2017 | $3,447 | $1,286,200 | $619,400 | $666,800 |
| 2016 | $3,469 | $1,280,000 | $619,400 | $660,600 |
| 2015 | $3,384 | $1,286,700 | $619,400 | $667,300 |
| 2014 | $3,962 | $1,597,600 | $647,400 | $950,200 |
Source: Public Records
Map
Nearby Homes
- 15 Old Farm Rd
- 37 Bijah's Way Unit 96, 101, 102
- 124 Old Farm Rd Unit 122, 116
- 122 Old Farm Rd
- 45 Quenames Rd
- 47 Quenames Rd
- 40 Scotchmans Ln
- 96 Hammett Ln
- 174 Middle Rd
- 60 Meetinghouse Rd
- 34 Ebens Ln Unit 20 and 22
- 34 Ebens Ln
- 104 Pond View Farm Rd
- 99 Cygnet Way Unit 103
- 85 Reservoir Rd
- 2 Other House Rd Unit 173
- 308 South Rd
- 6 Trails End
- 21 & 25 Fulling Mill Rd
- 25 Fulling Mill Rd
Your Personal Tour Guide
Ask me questions while you tour the home.