Estimated Value: $40,130 - $221,000
2
Beds
2
Baths
1,033
Sq Ft
$134/Sq Ft
Est. Value
About This Home
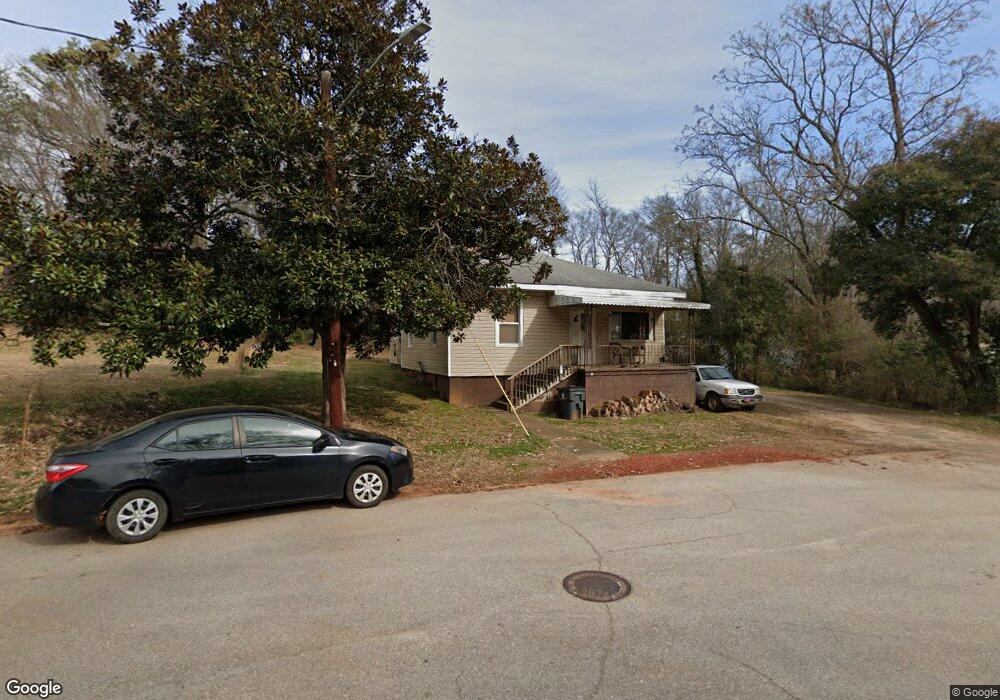
This home is located at 12 Middle St, Lyman, SC 29365 and is currently estimated at $138,533, approximately $134 per square foot. 12 Middle St is a home located in Spartanburg County with nearby schools including Duncan Elementary School, Byrnes Freshman Academy, and Beech Springs Intermediate School.
Ownership History
Date
Name
Owned For
Owner Type
Purchase Details
Closed on
Oct 25, 2016
Sold by
Baker Jack L
Bought by
Lambert Tina L
Current Estimated Value
Home Financials for this Owner
Home Financials are based on the most recent Mortgage that was taken out on this home.
Original Mortgage
$21,900
Outstanding Balance
$17,579
Interest Rate
3.5%
Mortgage Type
Purchase Money Mortgage
Estimated Equity
$120,954
Purchase Details
Closed on
Apr 16, 2014
Sold by
Wright Gloria A and Wright Latressa A
Bought by
Baker Jack L
Purchase Details
Closed on
Jan 7, 2011
Sold by
Butler Carolyn V and Butler James E
Bought by
Wright Gloria A and Wright Latressa A
Purchase Details
Closed on
Dec 28, 2009
Sold by
Butler Carolyn V and Butler James E
Bought by
Foster John E and Gaston Stella Ann
Purchase Details
Closed on
Sep 30, 2003
Sold by
Butler Carolyn V
Bought by
Butler James E
Create a Home Valuation Report for This Property
The Home Valuation Report is an in-depth analysis detailing your home's value as well as a comparison with similar homes in the area
Home Values in the Area
Average Home Value in this Area
Purchase History
| Date | Buyer | Sale Price | Title Company |
|---|---|---|---|
| Lambert Tina L | $22,900 | None Available | |
| Baker Jack L | $7,500 | -- | |
| Wright Gloria A | $10,000 | -- | |
| Foster John E | -- | -- | |
| Butler James E | -- | -- |
Source: Public Records
Mortgage History
| Date | Status | Borrower | Loan Amount |
|---|---|---|---|
| Open | Lambert Tina L | $21,900 |
Source: Public Records
Tax History
| Year | Tax Paid | Tax Assessment Tax Assessment Total Assessment is a certain percentage of the fair market value that is determined by local assessors to be the total taxable value of land and additions on the property. | Land | Improvement |
|---|---|---|---|---|
| 2022 | $979 | $2,160 | $475 | $1,685 |
| 2021 | $979 | $2,160 | $475 | $1,685 |
| 2020 | $967 | $2,160 | $475 | $1,685 |
| 2019 | $966 | $2,160 | $475 | $1,685 |
| 2018 | $951 | $2,160 | $475 | $1,685 |
| 2017 | $842 | $1,878 | $450 | $1,428 |
| 2016 | $833 | $1,878 | $450 | $1,428 |
| 2015 | $821 | $1,878 | $450 | $1,428 |
| 2014 | $700 | $1,593 | $749 | $844 |
Source: Public Records
Map
Nearby Homes
Your Personal Tour Guide
Ask me questions while you tour the home.