12 Milam Cir SW Cartersville, GA 30120
Estimated Value: $453,000 - $478,000
3
Beds
4
Baths
2,676
Sq Ft
$174/Sq Ft
Est. Value
About This Home
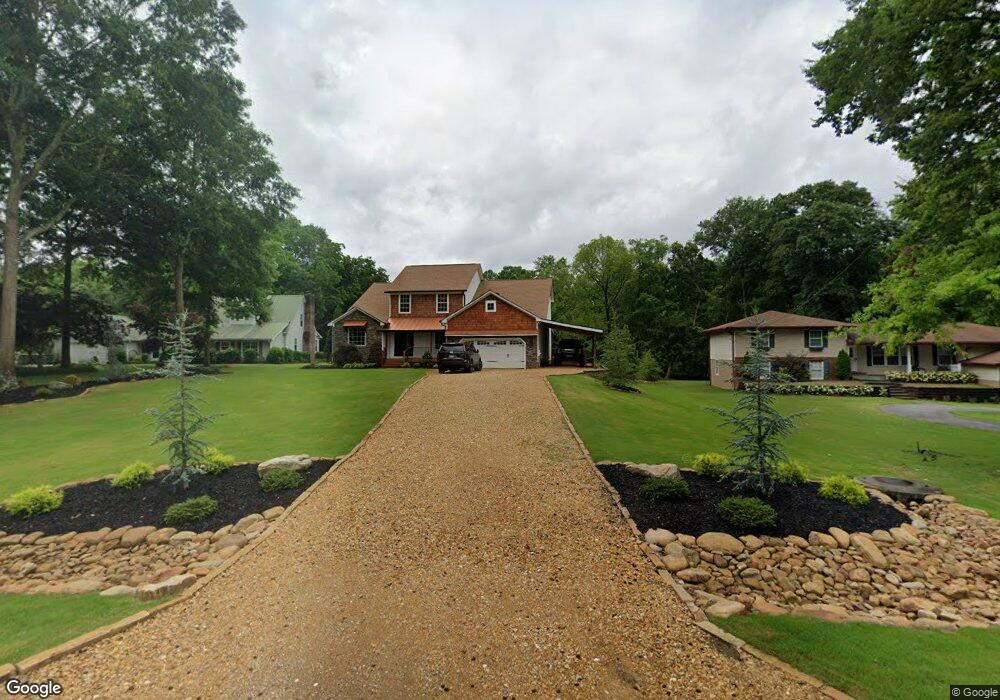
This home is located at 12 Milam Cir SW, Cartersville, GA 30120 and is currently estimated at $466,627, approximately $174 per square foot. 12 Milam Cir SW is a home located in Bartow County with nearby schools including Euharlee Elementary School, Woodland Middle School, and Woodland High School.
Ownership History
Date
Name
Owned For
Owner Type
Purchase Details
Closed on
Oct 30, 2020
Sold by
Hood Benny
Bought by
Weaver Danny
Current Estimated Value
Home Financials for this Owner
Home Financials are based on the most recent Mortgage that was taken out on this home.
Original Mortgage
$343,660
Outstanding Balance
$304,043
Interest Rate
2.8%
Mortgage Type
FHA
Estimated Equity
$162,584
Purchase Details
Closed on
Jul 9, 2019
Sold by
Oliverio Peter
Bought by
Hood Benny
Purchase Details
Closed on
May 15, 2012
Sold by
Hamilton State Bank
Bought by
Oliverio Peter and Oliverio Monica
Home Financials for this Owner
Home Financials are based on the most recent Mortgage that was taken out on this home.
Original Mortgage
$118,300
Interest Rate
3.9%
Mortgage Type
New Conventional
Purchase Details
Closed on
Jul 5, 2011
Sold by
Rothschild Charles H
Bought by
Hamilton State Bank
Create a Home Valuation Report for This Property
The Home Valuation Report is an in-depth analysis detailing your home's value as well as a comparison with similar homes in the area
Home Values in the Area
Average Home Value in this Area
Purchase History
| Date | Buyer | Sale Price | Title Company |
|---|---|---|---|
| Weaver Danny | $350,000 | -- | |
| Hood Benny | $278,500 | -- | |
| Oliverio Peter | $147,900 | -- | |
| Hamilton State Bank | -- | -- |
Source: Public Records
Mortgage History
| Date | Status | Borrower | Loan Amount |
|---|---|---|---|
| Open | Weaver Danny | $343,660 | |
| Previous Owner | Oliverio Peter | $118,300 |
Source: Public Records
Tax History Compared to Growth
Tax History
| Year | Tax Paid | Tax Assessment Tax Assessment Total Assessment is a certain percentage of the fair market value that is determined by local assessors to be the total taxable value of land and additions on the property. | Land | Improvement |
|---|---|---|---|---|
| 2024 | $4,258 | $158,464 | $50,000 | $108,464 |
| 2023 | $4,177 | $159,993 | $50,000 | $109,993 |
| 2022 | $4,263 | $149,994 | $50,000 | $99,994 |
| 2021 | $3,123 | $112,515 | $40,000 | $72,515 |
| 2020 | $3,212 | $112,515 | $40,000 | $72,515 |
| 2019 | $1,948 | $91,411 | $30,000 | $61,411 |
| 2018 | $2,620 | $89,443 | $30,000 | $59,443 |
| 2017 | $1,600 | $59,640 | $12,000 | $47,640 |
| 2016 | $1,612 | $59,640 | $12,000 | $47,640 |
| 2015 | $1,615 | $59,640 | $12,000 | $47,640 |
| 2014 | -- | $60,800 | $12,000 | $48,800 |
| 2013 | -- | $61,200 | $12,000 | $49,200 |
Source: Public Records
Map
Nearby Homes
- 58 Milam Cir SW
- 23 Lazy Water Dr SW
- 39 Lazy Water Dr SW
- 68 Lazy Water Dr SW
- 0 Lucas Rd SW Unit 23251541
- 0 Lucas Rd SW Unit 10616549
- 0 Euharlee Rd SW Unit 10518934
- 10 Dove Pointe
- 10 Jasmine Ln SW
- 11 Dove Pointe
- 17 River Walk Pkwy
- 19 Colleen Karen Rd SW Unit SW
- 19 Colleen Karen Rd SW
- 17 Lowry Way
- 19 Lowry Way
- 221 Chase Drew Dr SW
- 10 Overlook Cir
- 28 Cathedral Heights SW
- 235 Groveton Ct
- 12 Milam Cir SW
- 14 Milam Cir SW
- 10 Milam Cir SW
- 16 Milam Cir SW
- 11 Milam Cir SW
- 13 Milam Cir SW
- 15 Milam Cir SW
- 18 Milam Cir SW
- 18 Milam Cir SW
- 17 Milam Cir SW
- 280 Milam Bridge Rd SW
- 280 Milam Bridge Rd SW
- 20 Milam Cir SW
- 19 Milan Cir SW
- 19 Milam Cir SW
- 309 Covered Bridge Rd SW
- 297 Milam Bridge Rd SW
- 22 Milan Cir
- 22 Milam Cir SW
- 21 Milam Cir SW