
Seller's Agent in 2022
Kym Sullivan
Century 21 North East
(617) 308-4403
2 in this area
22 Total Sales
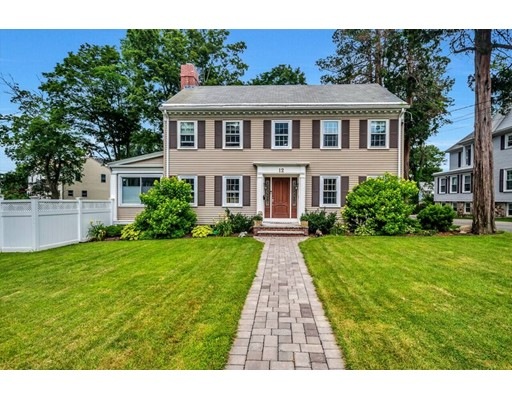
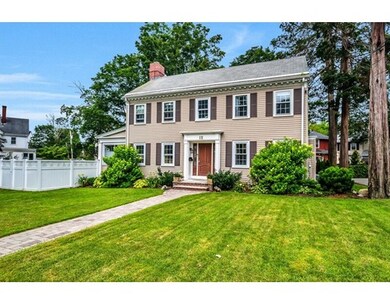
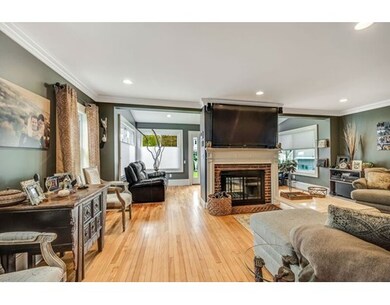
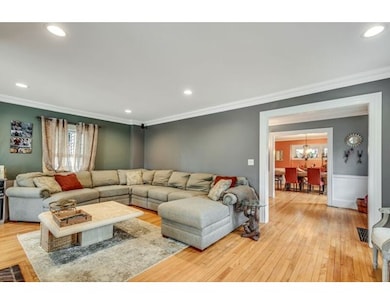
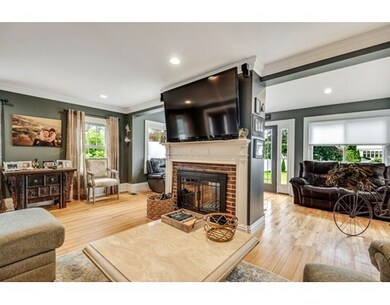
Pristine 4 bdrm Colonial located in desirable Central Square featuring a Chef's kitchen with all the bells and whistles, 6 burner gas cooktop, double ovens,french door fridge, microwave, beverage fridge, all stainless steel appliances and more.Double sided fireplace in living room. Front to back Master bedroom with walk in closet , Central A/C and a Hydro Air heating system A large fenced in yard with a sprinkler system and Patio area for your outdoor entertaining. Offers due Monday 7/24 @ 5pm
Home Type
Single Family
Est. Annual Taxes
$7,229
Year Built
1880
Lot Details
0
| Date | Type | Sale Price | Title Company |
|---|---|---|---|
| Not Resolvable | $850,000 | None Available | |
| Not Resolvable | $670,000 | -- | |
| Deed | $318,000 | -- | |
| Deed | $318,000 | -- |
| Date | Status | Loan Amount | Loan Type |
|---|---|---|---|
| Open | $665,000 | Purchase Money Mortgage | |
| Previous Owner | $536,000 | New Conventional | |
| Previous Owner | $308,460 | Purchase Money Mortgage | |
| Previous Owner | $123,000 | No Value Available |
| Date | Event | Price | Change | Sq Ft Price |
|---|---|---|---|---|
| 09/28/2022 09/28/22 | Sold | $958,000 | +2.0% | $387 / Sq Ft |
| 08/15/2022 08/15/22 | Pending | -- | -- | -- |
| 08/12/2022 08/12/22 | For Sale | $939,000 | +10.5% | $380 / Sq Ft |
| 08/02/2021 08/02/21 | Sold | $850,000 | -5.5% | $344 / Sq Ft |
| 06/04/2021 06/04/21 | Pending | -- | -- | -- |
| 05/20/2021 05/20/21 | For Sale | $899,900 | +34.3% | $364 / Sq Ft |
| 08/31/2017 08/31/17 | Sold | $670,000 | +3.1% | $264 / Sq Ft |
| 07/24/2017 07/24/17 | Pending | -- | -- | -- |
| 07/19/2017 07/19/17 | For Sale | $650,000 | -- | $257 / Sq Ft |
| Year | Tax Paid | Tax Assessment Tax Assessment Total Assessment is a certain percentage of the fair market value that is determined by local assessors to be the total taxable value of land and additions on the property. | Land | Improvement |
|---|---|---|---|---|
| 2025 | $7,229 | $846,500 | $334,700 | $511,800 |
| 2024 | $6,496 | $806,000 | $318,700 | $487,300 |
| 2023 | $6,333 | $727,900 | $289,700 | $438,200 |
| 2022 | $5,826 | $623,800 | $251,900 | $371,900 |
| 2021 | $5,595 | $599,700 | $239,900 | $359,800 |
| 2020 | $5,383 | $577,600 | $239,900 | $337,700 |
| 2019 | $5,203 | $547,700 | $228,500 | $319,200 |
| 2018 | $4,751 | $480,400 | $209,600 | $270,800 |
| 2017 | $4,419 | $444,600 | $199,700 | $244,900 |
| 2016 | $4,062 | $404,200 | $186,600 | $217,600 |
| 2015 | $3,916 | $385,100 | $174,400 | $210,700 |
| 2014 | $3,427 | $328,300 | $174,400 | $153,900 |
Seller's Agent in 2022
Kym Sullivan
Century 21 North East
(617) 308-4403
2 in this area
22 Total Sales
Buyer's Agent in 2022
Anne Spry
Barrett Sotheby's International Realty
(781) 405-4730
4 in this area
136 Total Sales
Seller's Agent in 2021
Tyler Lecao
BA Property & Lifestyle Advisors
(508) 649-3880
2 in this area
175 Total Sales
C
Seller's Agent in 2017
Carole DeNapoli
J. Mulkerin Realty
(781) 799-3236
6 Total Sales
Source: MLS Property Information Network (MLS PIN)
MLS Number: 72200613
APN: WOBU-000036-000010-000002
Disclaimer: Certain information contained herein is derived from information provided by parties other than Homes.com. All information provided is deemed reliable, but is not guaranteed to be accurate and should be independently verified.
![]() The property listing data and information, or the Images, set forth herein were provided to MLS Property Information Network, Inc. from third party sources, including sellers, lessors and public records, and were compiled by MLS Property Information Network, Inc. The property listing data and information, and the Images, are for the personal, non-commercial use of consumers having a good faith interest in purchasing or leasing listed properties of the type displayed to them and may not be used for any purpose other than to identify prospective properties which such consumers may have a good faith interest in purchasing or leasing. MLS Property Information Network, Inc. and its subscribers disclaim any and all representations and warranties as to the accuracy of the property listing data and information, or as to the accuracy of any of the Images, set forth herein.
The property listing data and information, or the Images, set forth herein were provided to MLS Property Information Network, Inc. from third party sources, including sellers, lessors and public records, and were compiled by MLS Property Information Network, Inc. The property listing data and information, and the Images, are for the personal, non-commercial use of consumers having a good faith interest in purchasing or leasing listed properties of the type displayed to them and may not be used for any purpose other than to identify prospective properties which such consumers may have a good faith interest in purchasing or leasing. MLS Property Information Network, Inc. and its subscribers disclaim any and all representations and warranties as to the accuracy of the property listing data and information, or as to the accuracy of any of the Images, set forth herein.