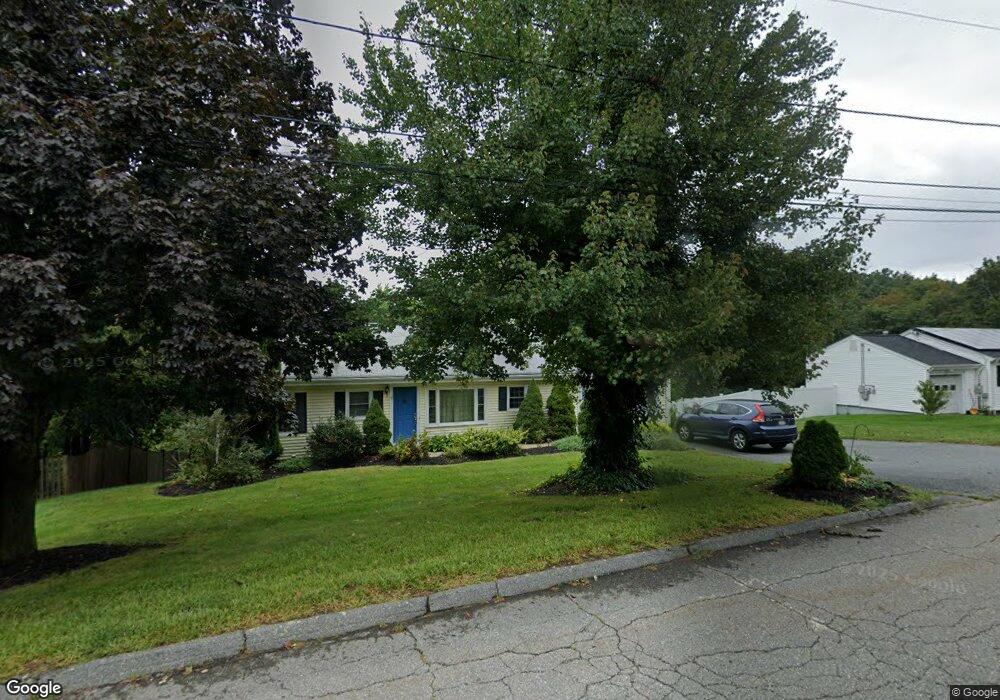
12 Mitchell St Unit 12 Southborough, MA 01772
Estimated Value: $653,000 - $929,000
4
Beds
2
Baths
2,300
Sq Ft
$337/Sq Ft
Est. Value
About This Home
This home is located at 12 Mitchell St Unit 12, Southborough, MA 01772 and is currently estimated at $775,049, approximately $336 per square foot. 12 Mitchell St Unit 12 is a home located in Worcester County with nearby schools including Albert S. Woodward Memorial School, Margaret A. Neary School, and P. Brent Trottier Middle School.
Ownership History
Date
Name
Owned For
Owner Type
Purchase Details
Closed on
Dec 20, 2013
Sold by
Maselli Leo J Est and Maselli
Bought by
Singh Geeta and Singh Balaji
Current Estimated Value
Home Financials for this Owner
Home Financials are based on the most recent Mortgage that was taken out on this home.
Original Mortgage
$337,410
Outstanding Balance
$250,823
Interest Rate
4.15%
Mortgage Type
New Conventional
Estimated Equity
$524,226
Create a Home Valuation Report for This Property
The Home Valuation Report is an in-depth analysis detailing your home's value as well as a comparison with similar homes in the area
Home Values in the Area
Average Home Value in this Area
Purchase History
| Date | Buyer | Sale Price | Title Company |
|---|---|---|---|
| Singh Geeta | $374,900 | -- |
Source: Public Records
Mortgage History
| Date | Status | Borrower | Loan Amount |
|---|---|---|---|
| Open | Singh Geeta | $337,410 |
Source: Public Records
Tax History Compared to Growth
Tax History
| Year | Tax Paid | Tax Assessment Tax Assessment Total Assessment is a certain percentage of the fair market value that is determined by local assessors to be the total taxable value of land and additions on the property. | Land | Improvement |
|---|---|---|---|---|
| 2025 | $7,520 | $544,500 | $302,100 | $242,400 |
| 2024 | $7,360 | $529,100 | $292,800 | $236,300 |
| 2023 | $7,514 | $509,100 | $285,500 | $223,600 |
| 2022 | $7,109 | $436,700 | $244,600 | $192,100 |
| 2021 | $6,957 | $429,200 | $232,400 | $196,800 |
| 2020 | $6,829 | $409,900 | $218,900 | $191,000 |
| 2019 | $4,578 | $397,200 | $209,700 | $187,500 |
| 2018 | $1,706 | $390,000 | $209,700 | $180,300 |
| 2017 | $6,324 | $386,100 | $209,700 | $176,400 |
| 2016 | $5,977 | $377,800 | $205,400 | $172,400 |
| 2015 | $5,778 | $360,700 | $200,900 | $159,800 |
Source: Public Records
Map
Nearby Homes
- 7 John St
- 1 Carriage Hill Cir Unit 1
- 9 Cherry St
- 216 Boston Rd
- 40 William Onthank Ln
- 1 Blueberry Ln
- 38 William Onthank Ln
- 21 William Onthank Ln
- 36 E Main St
- 8 Lorenzo Dr
- 58 Framingham Rd
- 14 Pinehill Rd
- 6 Witherbee Ln
- 24 Angelica Dr
- 9 John Matthews Rd
- 25 Lanewood Ave
- Lot 2 Quinn Rd
- 23 Stonebrook Ct Unit 11
- 58 Pine Hill Rd
- 7 Rockpoint Rd