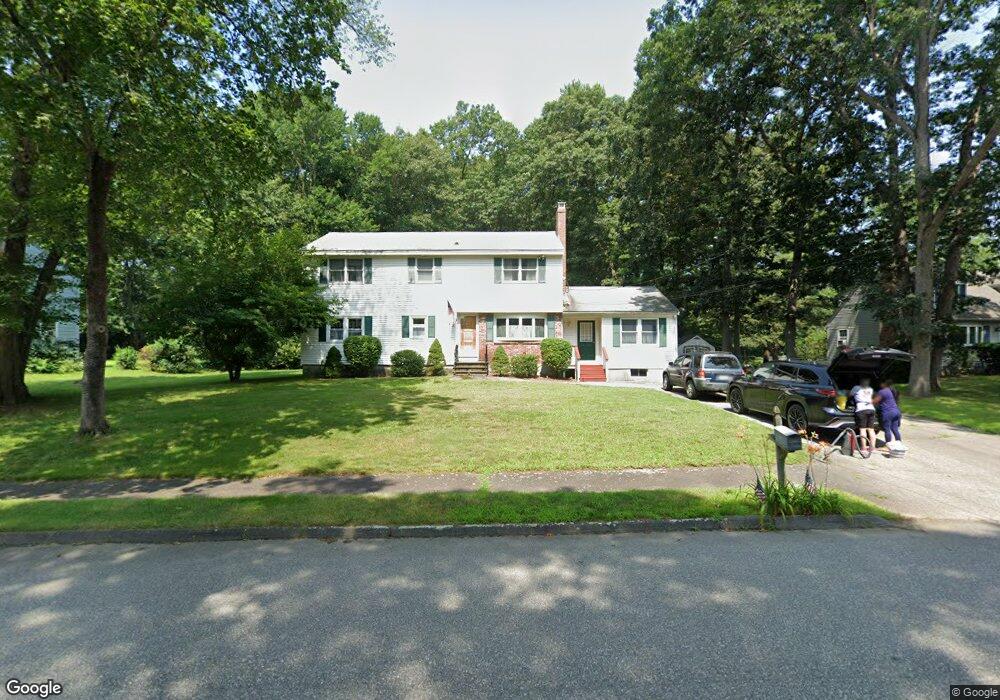
12 Moore St Wilmington, MA 01887
Estimated Value: $847,572 - $951,000
4
Beds
2
Baths
2,488
Sq Ft
$368/Sq Ft
Est. Value
About This Home
This home is located at 12 Moore St, Wilmington, MA 01887 and is currently estimated at $914,643, approximately $367 per square foot. 12 Moore St is a home located in Middlesex County with nearby schools including Wilmington Middle School and Wilmington High School.
Ownership History
Date
Name
Owned For
Owner Type
Purchase Details
Closed on
Mar 12, 2021
Sold by
Wwc Ft
Bought by
Duran Christine and Duran Scott
Current Estimated Value
Home Financials for this Owner
Home Financials are based on the most recent Mortgage that was taken out on this home.
Original Mortgage
$477,000
Outstanding Balance
$427,597
Interest Rate
2.7%
Mortgage Type
Purchase Money Mortgage
Estimated Equity
$487,046
Purchase Details
Closed on
Dec 16, 2018
Sold by
Wilder-Cassim William and Cassim Judith E
Bought by
Wwc Ft
Purchase Details
Closed on
Feb 27, 1987
Sold by
Perry Manuel S
Bought by
Cossim Wm W
Home Financials for this Owner
Home Financials are based on the most recent Mortgage that was taken out on this home.
Original Mortgage
$119,000
Interest Rate
9.19%
Mortgage Type
Purchase Money Mortgage
Create a Home Valuation Report for This Property
The Home Valuation Report is an in-depth analysis detailing your home's value as well as a comparison with similar homes in the area
Home Values in the Area
Average Home Value in this Area
Purchase History
| Date | Buyer | Sale Price | Title Company |
|---|---|---|---|
| Duran Christine | $636,000 | None Available | |
| Wwc Ft | -- | -- | |
| Wwc Ft | -- | -- | |
| Cossim Wm W | $149,000 | -- |
Source: Public Records
Mortgage History
| Date | Status | Borrower | Loan Amount |
|---|---|---|---|
| Open | Duran Christine | $477,000 | |
| Previous Owner | Cossim Wm W | $80,000 | |
| Previous Owner | Cossim Wm W | $119,000 |
Source: Public Records
Tax History Compared to Growth
Tax History
| Year | Tax Paid | Tax Assessment Tax Assessment Total Assessment is a certain percentage of the fair market value that is determined by local assessors to be the total taxable value of land and additions on the property. | Land | Improvement |
|---|---|---|---|---|
| 2025 | $9,002 | $786,200 | $312,900 | $473,300 |
| 2024 | $8,822 | $771,800 | $312,900 | $458,900 |
| 2023 | $8,582 | $718,800 | $284,500 | $434,300 |
| 2022 | $8,080 | $620,100 | $237,000 | $383,100 |
| 2021 | $8,088 | $584,400 | $215,400 | $369,000 |
| 2020 | $7,864 | $579,100 | $215,400 | $363,700 |
| 2019 | $7,688 | $559,100 | $205,100 | $354,000 |
| 2018 | $7,559 | $524,600 | $195,400 | $329,200 |
| 2017 | $7,393 | $511,600 | $195,400 | $316,200 |
| 2016 | $6,892 | $471,100 | $186,200 | $284,900 |
| 2015 | $6,632 | $461,500 | $186,200 | $275,300 |
| 2014 | $6,240 | $438,200 | $177,400 | $260,800 |
Source: Public Records
Map
Nearby Homes