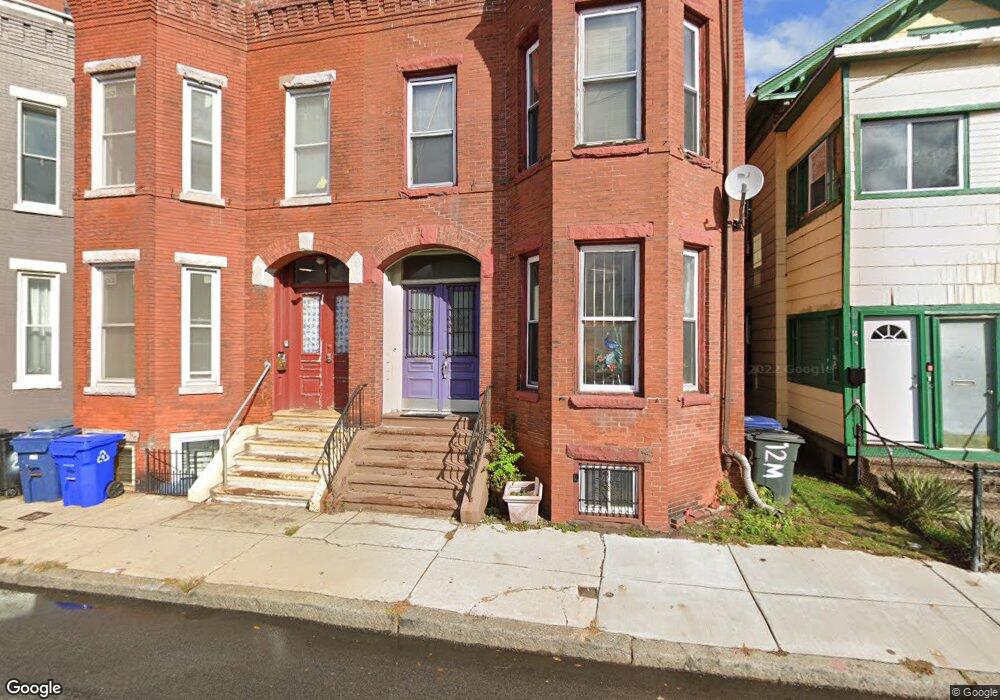
12 Moreland St Roxbury, MA 02119
Sav-Mor NeighborhoodEstimated Value: $637,723 - $823,000
About This Home
This home is located at 12 Moreland St, Roxbury, MA 02119 and is currently estimated at $723,681, approximately $338 per square foot. 12 Moreland St is a home located in Suffolk County with nearby schools including City on a Hill Charter Public School.
Ownership History
We collect this data history from publicly available records. To have your information removed, we recommend requesting removal directly through your county’s website.
Purchase Details
Home Values in the Area
Average Home Value in this Area
Purchase History
We collect this data history from publicly available records. To have your information removed, we recommend requesting removal directly through your county’s website.
| Date | Buyer | Sale Price | Title Company |
|---|---|---|---|
| $120,000 | -- |
Mortgage History
We collect this data history from publicly available records. To have your information removed, we recommend requesting removal directly through your county’s website.
| Date | Status | Borrower | Loan Amount |
|---|---|---|---|
| Open | $225,000 | ||
| Closed | $114,480 | ||
| Closed | $50,000 |
Tax History
We collect this data history from publicly available records. To have your information removed, we recommend requesting removal directly through your county’s website.
| Year | Tax Paid | Tax Assessment Tax Assessment Total Assessment is a certain percentage of the fair market value that is determined by local assessors to be the total taxable value of land and additions on the property. | Land | Improvement |
|---|---|---|---|---|
| 2025 | $6,040 | $521,600 | $147,300 | $374,300 |
| 2024 | $5,931 | $544,100 | $148,600 | $395,500 |
| 2023 | $5,844 | $544,100 | $148,600 | $395,500 |
| 2022 | $5,382 | $494,700 | $135,100 | $359,600 |
| 2021 | $5,278 | $494,700 | $135,100 | $359,600 |
| 2020 | $4,846 | $458,900 | $131,500 | $327,400 |
| 2019 | $4,521 | $428,900 | $103,300 | $325,600 |
| 2018 | $4,087 | $390,000 | $103,300 | $286,700 |
| 2017 | $4,008 | $378,500 | $103,300 | $275,200 |
| 2016 | $3,966 | $360,500 | $103,300 | $257,200 |
| 2015 | $3,683 | $304,100 | $64,900 | $239,200 |
| 2014 | $3,714 | $295,200 | $64,900 | $230,300 |
Map
- 6 Moreland St
- 27 Saint James St
- 4 Kearsarge Ave
- 17 Akron St Unit 2
- 62 Winthrop St Unit 2
- 12 Forest St
- 10 Roxbury St
- 101 Mount Pleasant Ave
- 10 Forest St
- 299 Dudley St
- 301-305 Dudley St
- 1 Copeland Place
- 16 Taber St Unit 203
- 22 Kenilworth St
- 33 Copeland St Unit C
- 7 Langford Park Unit 1
- 15 Guild St Unit 302
- 94 Walnut Ave
- 9 W Cedar St
- 113 Regent St
- 8 Moreland St
- 10 Moreland St Unit 2
- 10 Moreland St Unit 1
- 10 Moreland St
- 10 Moreland St Unit H-3
- 10 Moreland St Unit 102
- 10 Moreland St Unit Moreland St
- 10 Moreland St
- 6 Moreland St Unit 3
- 6 Moreland St Unit 1
- 6 Moreland St Unit 5A
- 6 Moreland St Unit 4
- 4 Moreland St Unit 4
- 14 Moreland St
- 2 Moreland St Unit 3
- 2 Moreland St
- 2 Moreland St Unit 1
- 130 Warren St Unit 2
- 130 Warren St Unit 1
- 130 Warren St
Ask me questions while you tour the home.