Estimated Value: $139,000 - $164,000
3
Beds
3
Baths
1,708
Sq Ft
$88/Sq Ft
Est. Value
About This Home
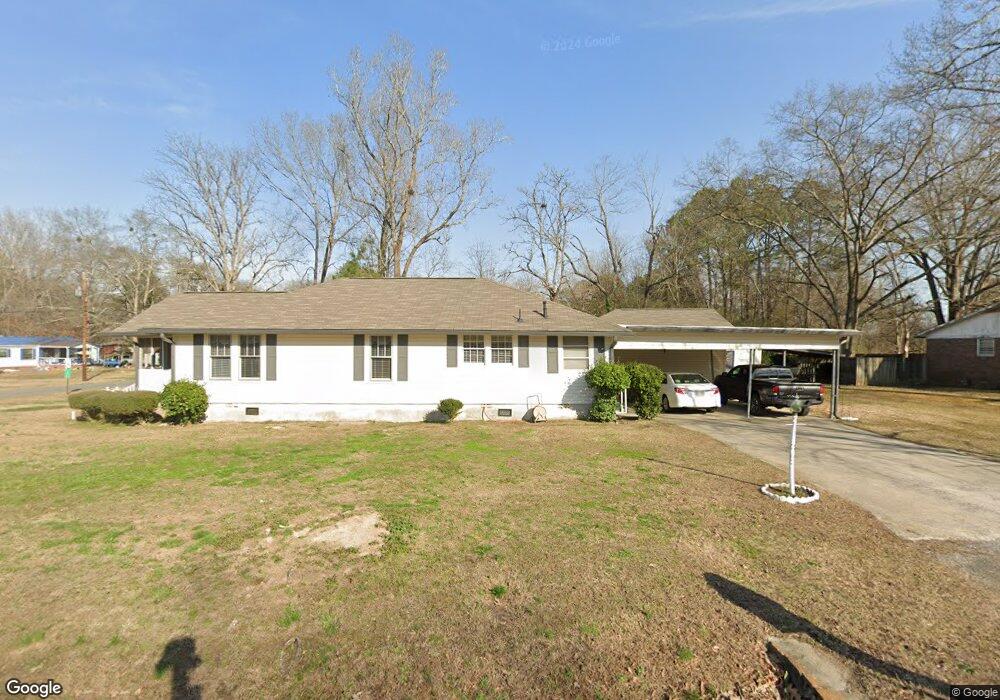
This home is located at 12 Morningside Dr NW, Rome, GA 30165 and is currently estimated at $149,667, approximately $87 per square foot. 12 Morningside Dr NW is a home located in Floyd County with nearby schools including Coosa Middle School and Coosa High School.
Ownership History
Date
Name
Owned For
Owner Type
Purchase Details
Closed on
May 12, 2021
Sold by
Chandler J W
Bought by
Equity Trust Co Custodian Fbo
Current Estimated Value
Purchase Details
Closed on
Oct 31, 2012
Sold by
Federal Home Loan Mortgage Corporation
Bought by
Chandler J W
Purchase Details
Closed on
Feb 7, 2012
Sold by
Jpmorgan Chase Bank Nation
Bought by
Federal Home Loan Mortgage Corporation
Purchase Details
Closed on
Mar 30, 2000
Sold by
Bryant-Forbes Peter
Bought by
Silvers Brandy T
Purchase Details
Closed on
May 1, 1996
Sold by
Jordan Wanda Thomas
Bought by
Bryant-Forbes Peter
Purchase Details
Closed on
Dec 31, 1994
Bought by
P and R
Purchase Details
Closed on
Oct 18, 1994
Bought by
P and R
Purchase Details
Closed on
Nov 4, 1991
Sold by
Chandler H J Mrs
Bought by
Sutton Louise Trustee
Purchase Details
Closed on
Jun 4, 1990
Bought by
P and R
Purchase Details
Closed on
Jan 1, 1901
Bought by
Chandler H J Mrs
Create a Home Valuation Report for This Property
The Home Valuation Report is an in-depth analysis detailing your home's value as well as a comparison with similar homes in the area
Home Values in the Area
Average Home Value in this Area
Purchase History
| Date | Buyer | Sale Price | Title Company |
|---|---|---|---|
| Equity Trust Co Custodian Fbo | $28,000 | -- | |
| Chandler J W | $7,100 | -- | |
| Federal Home Loan Mortgage Corporation | $15,900 | -- | |
| Jpmorgan Chase Bank | $15,900 | -- | |
| Silvers Brandy T | $38,000 | -- | |
| Bryant-Forbes Peter | $20,000 | -- | |
| P | -- | -- | |
| P | -- | -- | |
| Jordan Wanda Thomas | -- | -- | |
| Sutton Louise Trustee | -- | -- | |
| P | -- | -- | |
| Chandler H J Mrs | -- | -- |
Source: Public Records
Tax History Compared to Growth
Tax History
| Year | Tax Paid | Tax Assessment Tax Assessment Total Assessment is a certain percentage of the fair market value that is determined by local assessors to be the total taxable value of land and additions on the property. | Land | Improvement |
|---|---|---|---|---|
| 2024 | $2,322 | $56,390 | $2,886 | $53,504 |
| 2023 | $1,050 | $29,899 | $2,624 | $27,275 |
| 2022 | $263 | $7,206 | $2,099 | $5,107 |
| 2021 | $248 | $6,682 | $2,099 | $4,583 |
| 2020 | $223 | $5,966 | $1,640 | $4,326 |
| 2019 | $211 | $5,704 | $1,640 | $4,064 |
| 2018 | $202 | $5,448 | $1,640 | $3,808 |
| 2017 | $196 | $5,288 | $1,640 | $3,648 |
| 2016 | $192 | $5,160 | $1,640 | $3,520 |
| 2015 | $100 | $4,000 | $1,640 | $2,360 |
| 2014 | $100 | $4,000 | $1,640 | $2,360 |
Source: Public Records
Map
Nearby Homes
- 86 N Avery Rd NW
- 53 Northside Dr NW
- 87 Northside Dr NW
- 45 Albert Ave NW
- 293 N Avery Rd NW
- 16 Polaris Terrace NW
- 0 Charleston Dr NW Unit 10543945
- 0 Charleston Dr NW Unit 7598114
- 1 Ann Dr NW
- 4485 Alabama Hwy
- 876 Barker Rd SW
- 3105 Barker Rd SW
- 10 Nest Dr NW
- 48 Atwood Dr NW
- 3605 Garden Lakes Pkwy
- 224 Rolling Oaks Dr NW
- 2890 Alabama Hwy NW
- 48 Fox Croft Rd NW
- 212 Rolling Oaks Dr NW
- 106 Eden Dr NW
- 12 Morningside Dr NW
- 10 Morningside Dr NW
- 10 Morningside Dr NW
- 0 Morningside Dr NW Unit 7063474
- 0 Morningside Dr NW Unit 8745101
- 0 Morningside Dr NW Unit 8395548
- 0 Morningside Dr NW Unit 3286123
- 0 Morningside Dr NW
- 26 Highland Blvd NW
- 26 Highland Blvd NW
- 26 Morningside Dr NW
- 21 Highland Blvd NW
- 30 Morningside Dr NW
- 24 Highland Blvd NW
- 9 Morningside Dr NW
- 9 Morningside Dr NW
- 9 Morningside Dr NW
- 0 Highland Blvd NW Unit 3156471
- 10 Norcross Rd NW
- 19 Highland Blvd NW