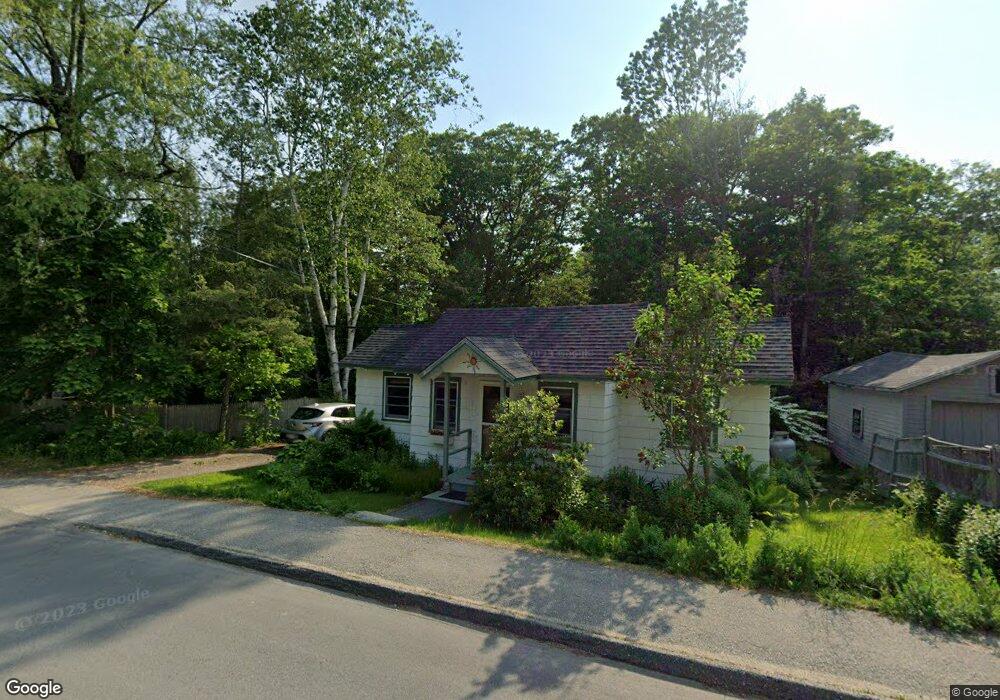
12 Mount Battie St Camden, ME 04843
Estimated Value: $329,703 - $415,000
2
Beds
1
Bath
1,000
Sq Ft
$358/Sq Ft
Est. Value
About This Home
This home is located at 12 Mount Battie St, Camden, ME 04843 and is currently estimated at $357,676, approximately $357 per square foot. 12 Mount Battie St is a home located in Knox County with nearby schools including Camden-Rockport Elementary School, Camden-Rockport Middle School, and Camden Hills Regional High School.
Ownership History
Date
Name
Owned For
Owner Type
Purchase Details
Closed on
Jan 18, 2005
Sold by
Fisher Ralph B and Fisher Brenda E
Bought by
Lindquist Kristen E and Doiron Paul V
Current Estimated Value
Home Financials for this Owner
Home Financials are based on the most recent Mortgage that was taken out on this home.
Original Mortgage
$126,000
Outstanding Balance
$63,868
Interest Rate
5.81%
Mortgage Type
Purchase Money Mortgage
Estimated Equity
$293,808
Create a Home Valuation Report for This Property
The Home Valuation Report is an in-depth analysis detailing your home's value as well as a comparison with similar homes in the area
Home Values in the Area
Average Home Value in this Area
Purchase History
| Date | Buyer | Sale Price | Title Company |
|---|---|---|---|
| Lindquist Kristen E | -- | -- |
Source: Public Records
Mortgage History
| Date | Status | Borrower | Loan Amount |
|---|---|---|---|
| Open | Lindquist Kristen E | $126,000 |
Source: Public Records
Tax History Compared to Growth
Tax History
| Year | Tax Paid | Tax Assessment Tax Assessment Total Assessment is a certain percentage of the fair market value that is determined by local assessors to be the total taxable value of land and additions on the property. | Land | Improvement |
|---|---|---|---|---|
| 2024 | $2,661 | $253,400 | $109,200 | $144,200 |
| 2023 | $2,314 | $167,700 | $46,800 | $120,900 |
| 2022 | $2,214 | $167,700 | $46,800 | $120,900 |
| 2021 | $2,144 | $139,700 | $47,300 | $92,400 |
| 2020 | $2,100 | $139,700 | $47,300 | $92,400 |
| 2019 | $2,083 | $139,700 | $47,300 | $92,400 |
| 2018 | $1,812 | $121,800 | $44,800 | $77,000 |
| 2017 | $1,751 | $121,800 | $44,800 | $77,000 |
| 2016 | $2,010 | $128,900 | $50,300 | $78,600 |
| 2015 | $1,950 | $128,900 | $50,300 | $78,600 |
| 2014 | $1,860 | $128,900 | $50,300 | $78,600 |
| 2013 | $1,810 | $128,900 | $50,300 | $78,600 |
Source: Public Records
Map
Nearby Homes