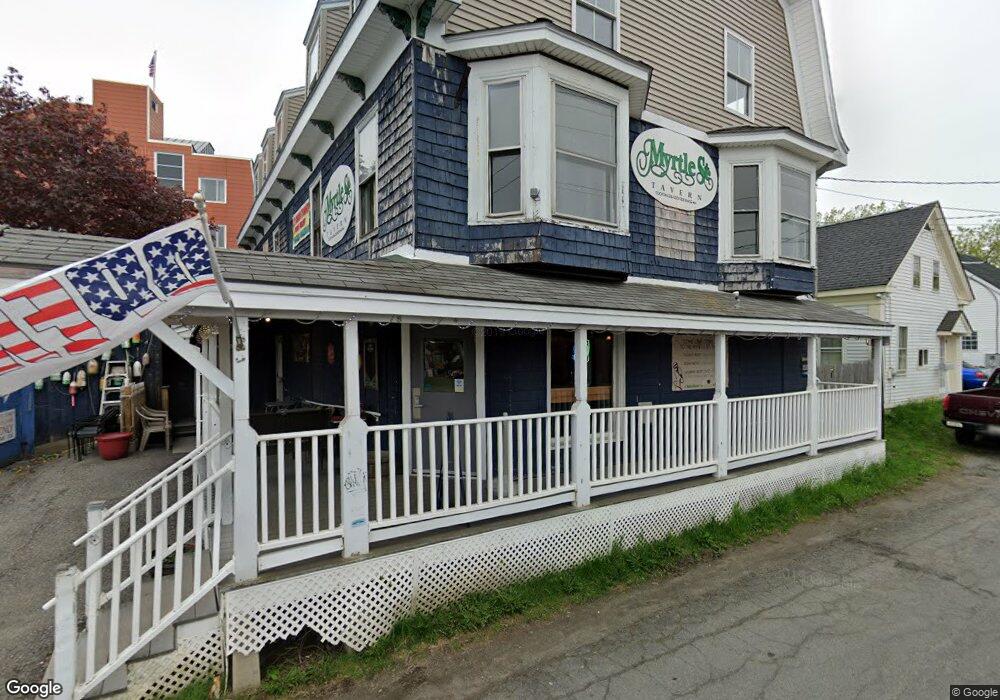
12 Myrtle St Rockland, ME 04841
--
Bed
2
Baths
4,527
Sq Ft
3,049
Sq Ft Lot
About This Home
This home is located at 12 Myrtle St, Rockland, ME 04841. 12 Myrtle St is a home located in Knox County with nearby schools including South School, Oceanside High School East, and Pen Bay Christian School.
Ownership History
Date
Name
Owned For
Owner Type
Purchase Details
Closed on
Jan 25, 2019
Sold by
Myrtle St Properties Llc
Bought by
Myrtle St Properties Llc
Home Financials for this Owner
Home Financials are based on the most recent Mortgage that was taken out on this home.
Original Mortgage
$118,000
Outstanding Balance
$103,539
Interest Rate
4.6%
Mortgage Type
New Conventional
Purchase Details
Closed on
Jun 23, 2005
Sold by
Brann Warner S and Brann Mary R
Bought by
Myrtle Street Props Llc
Home Financials for this Owner
Home Financials are based on the most recent Mortgage that was taken out on this home.
Original Mortgage
$256,000
Interest Rate
5.82%
Mortgage Type
Purchase Money Mortgage
Create a Home Valuation Report for This Property
The Home Valuation Report is an in-depth analysis detailing your home's value as well as a comparison with similar homes in the area
Home Values in the Area
Average Home Value in this Area
Purchase History
| Date | Buyer | Sale Price | Title Company |
|---|---|---|---|
| Myrtle St Properties Llc | -- | -- | |
| Myrtle Street Props Llc | -- | -- |
Source: Public Records
Mortgage History
| Date | Status | Borrower | Loan Amount |
|---|---|---|---|
| Open | Myrtle St Properties Llc | $118,000 | |
| Previous Owner | Myrtle Street Props Llc | $256,000 |
Source: Public Records
Tax History Compared to Growth
Tax History
| Year | Tax Paid | Tax Assessment Tax Assessment Total Assessment is a certain percentage of the fair market value that is determined by local assessors to be the total taxable value of land and additions on the property. | Land | Improvement |
|---|---|---|---|---|
| 2024 | $9,552 | $390,200 | $78,800 | $311,400 |
| 2023 | $9,259 | $381,500 | $78,800 | $302,700 |
| 2022 | $9,456 | $389,600 | $78,800 | $310,800 |
| 2021 | $8,805 | $389,600 | $78,800 | $310,800 |
| 2020 | $8,688 | $389,600 | $78,800 | $310,800 |
| 2019 | $9,694 | $391,500 | $84,600 | $306,900 |
| 2018 | $7,446 | $322,600 | $80,500 | $242,100 |
| 2017 | $7,188 | $322,600 | $80,500 | $242,100 |
| 2016 | $7,007 | $322,600 | $80,500 | $242,100 |
| 2015 | $6,839 | $322,600 | $80,500 | $242,100 |
| 2014 | $6,504 | $322,600 | $80,500 | $242,100 |
| 2013 | $6,297 | $322,600 | $80,500 | $242,100 |
Source: Public Records
Map
Nearby Homes