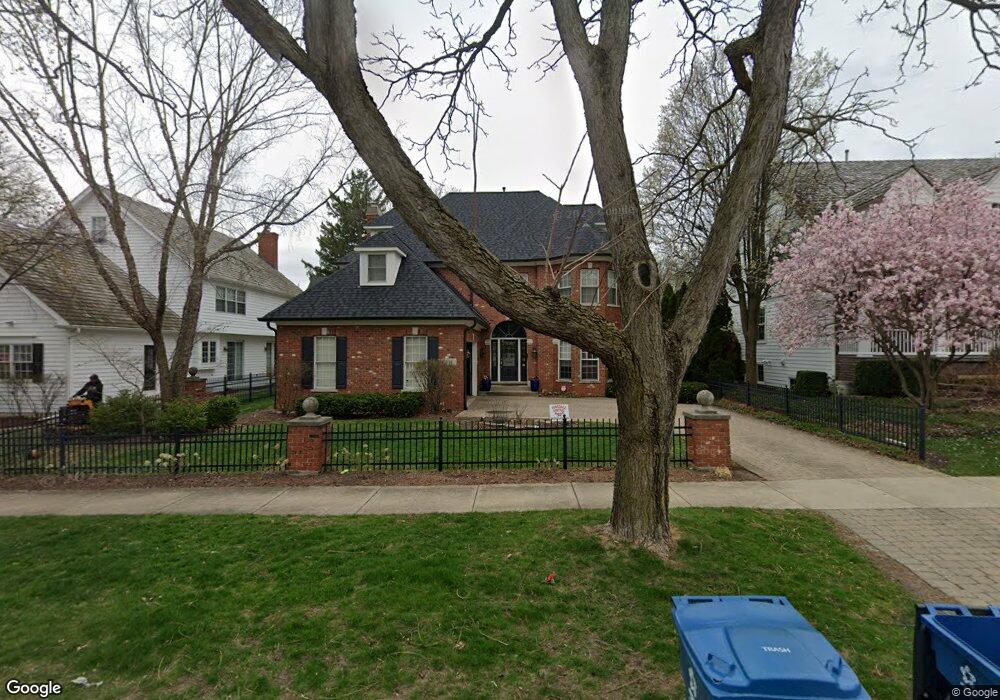
12 N Clay St Hinsdale, IL 60521
Downtown Hinsdale NeighborhoodEstimated Value: $1,563,120 - $1,832,000
5
Beds
5
Baths
3,526
Sq Ft
$482/Sq Ft
Est. Value
About This Home
This home is located at 12 N Clay St, Hinsdale, IL 60521 and is currently estimated at $1,699,373, approximately $481 per square foot. 12 N Clay St is a home located in DuPage County with nearby schools including Monroe Elementary School, Clarendon Hills Middle School, and Hinsdale Central High School.
Ownership History
Date
Name
Owned For
Owner Type
Purchase Details
Closed on
Apr 4, 2017
Sold by
Boots Kavian B and Boots Jennifer L
Bought by
Boots Kavian B and Boots Jennifer L
Current Estimated Value
Purchase Details
Closed on
Jun 23, 1998
Sold by
Downers Grove National Bank
Bought by
Schoen Raymond E and Schoen Audrey
Home Financials for this Owner
Home Financials are based on the most recent Mortgage that was taken out on this home.
Original Mortgage
$160,000
Interest Rate
7.27%
Purchase Details
Closed on
Feb 13, 1998
Sold by
Downers Grove National Bank
Bought by
Downers Grove National Bank and Trust #94-105
Create a Home Valuation Report for This Property
The Home Valuation Report is an in-depth analysis detailing your home's value as well as a comparison with similar homes in the area
Home Values in the Area
Average Home Value in this Area
Purchase History
| Date | Buyer | Sale Price | Title Company |
|---|---|---|---|
| Boots Kavian B | -- | Attorney | |
| Schoen Raymond E | $730,000 | -- | |
| Downers Grove National Bank | $250,000 | -- |
Source: Public Records
Mortgage History
| Date | Status | Borrower | Loan Amount |
|---|---|---|---|
| Closed | Schoen Raymond E | $160,000 |
Source: Public Records
Tax History Compared to Growth
Tax History
| Year | Tax Paid | Tax Assessment Tax Assessment Total Assessment is a certain percentage of the fair market value that is determined by local assessors to be the total taxable value of land and additions on the property. | Land | Improvement |
|---|---|---|---|---|
| 2024 | $18,846 | $371,538 | $107,431 | $264,107 |
| 2023 | $17,914 | $341,550 | $98,760 | $242,790 |
| 2022 | $17,847 | $346,400 | $100,170 | $246,230 |
| 2021 | $17,197 | $342,460 | $99,030 | $243,430 |
| 2020 | $16,806 | $335,680 | $97,070 | $238,610 |
| 2019 | $16,815 | $322,090 | $93,140 | $228,950 |
| 2018 | $16,087 | $319,470 | $92,660 | $226,810 |
| 2017 | $19,245 | $380,160 | $89,160 | $291,000 |
| 2016 | $18,878 | $362,810 | $85,090 | $277,720 |
| 2015 | $18,796 | $341,330 | $80,050 | $261,280 |
| 2014 | $17,838 | $313,050 | $77,830 | $235,220 |
| 2013 | $17,490 | $311,590 | $77,470 | $234,120 |
Source: Public Records
Map
Nearby Homes
- 28 S Clay St
- 14 S Thurlow St
- 123 N Vine St
- 117 N Monroe St
- 118 N Grant St
- 125 S Madison St
- 210 W Hickory St
- 216 S Madison St
- 21 S Bruner St
- 415 N Adams St
- 443 S Clay St
- 11S110 LOT Madison St
- 539 Kensington Ct
- 527 Kensington Ct
- 530 W 6th St
- 246 N Jackson Rd
- 527 W Ogden Ave
- 241 Coe Rd
- 626 S Bodin St
- 6 S Elm St