12 N Decker Ave Baltimore, MD 21224
Patterson Park NeighborhoodEstimated Value: $273,943 - $360,000
2
Beds
2
Baths
960
Sq Ft
$330/Sq Ft
Est. Value
About This Home
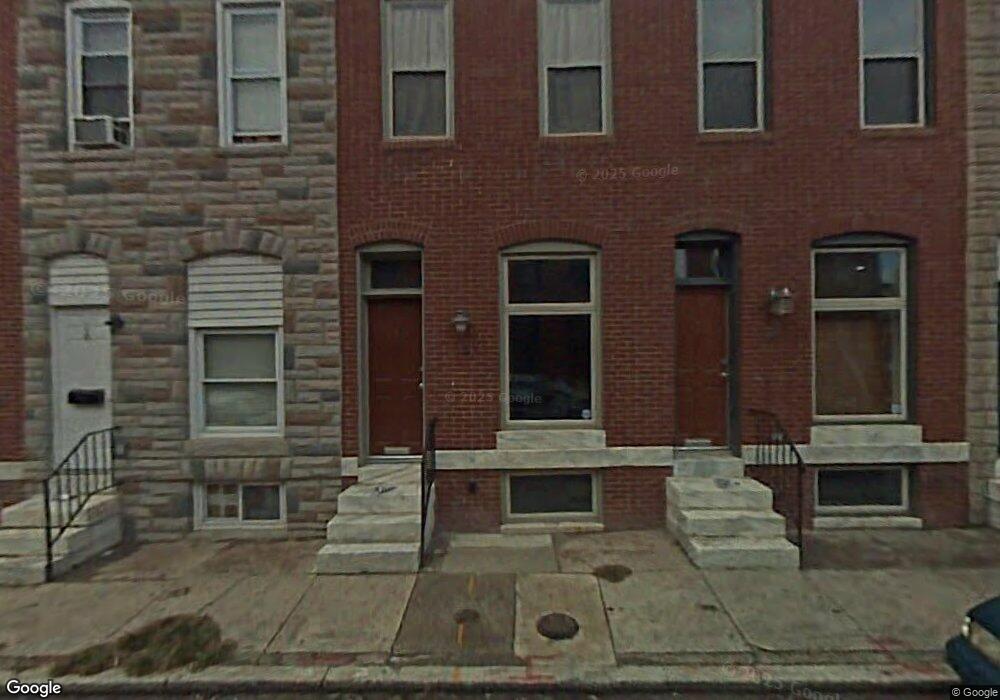
This home is located at 12 N Decker Ave, Baltimore, MD 21224 and is currently estimated at $316,972, approximately $330 per square foot. 12 N Decker Ave is a home located in Baltimore City with nearby schools including Highlandtown Elementary/Middle School No. 215, Booker T. Washington Middle School, and Paul Laurence Dunbar High School.
Ownership History
Date
Name
Owned For
Owner Type
Purchase Details
Closed on
Sep 18, 2025
Sold by
Bohse Stephen R and Ralston William L
Bought by
Tanzo Normangel S
Current Estimated Value
Purchase Details
Closed on
Jul 13, 2006
Sold by
Patterson Park Community
Bought by
Monaghan Brian A
Home Financials for this Owner
Home Financials are based on the most recent Mortgage that was taken out on this home.
Original Mortgage
$39,000
Interest Rate
6.34%
Mortgage Type
Purchase Money Mortgage
Purchase Details
Closed on
Mar 12, 2004
Sold by
Wildcatz Ii L.L.C
Bought by
Patterson Park Community
Purchase Details
Closed on
Jun 25, 2003
Sold by
Whitesands Llc
Bought by
Wildcats I Llc
Purchase Details
Closed on
Jun 4, 2003
Sold by
Wildcatz Ii L.L.C
Bought by
Patterson Park Community and Development Corporation
Purchase Details
Closed on
Apr 23, 2003
Sold by
Gullace Robert A
Bought by
Whitesands Llc
Purchase Details
Closed on
Jan 25, 1999
Sold by
Smith Joseph V
Bought by
Gullace Robert A
Create a Home Valuation Report for This Property
The Home Valuation Report is an in-depth analysis detailing your home's value as well as a comparison with similar homes in the area
Home Values in the Area
Average Home Value in this Area
Purchase History
| Date | Buyer | Sale Price | Title Company |
|---|---|---|---|
| Tanzo Normangel S | $1,000 | None Listed On Document | |
| Monaghan Brian A | $260,000 | -- | |
| Patterson Park Community | $36,000 | -- | |
| Wildcatz Ii L.L.C | -- | -- | |
| Wildcats I Llc | $29,000 | -- | |
| Patterson Park Community | $36,000 | -- | |
| Wildcatz Ii L.L.C | -- | -- | |
| Whitesands Llc | $16,000 | -- | |
| Gullace Robert A | $62,000 | -- |
Source: Public Records
Mortgage History
| Date | Status | Borrower | Loan Amount |
|---|---|---|---|
| Previous Owner | Monaghan Brian A | $39,000 |
Source: Public Records
Tax History Compared to Growth
Tax History
| Year | Tax Paid | Tax Assessment Tax Assessment Total Assessment is a certain percentage of the fair market value that is determined by local assessors to be the total taxable value of land and additions on the property. | Land | Improvement |
|---|---|---|---|---|
| 2025 | $5,120 | $228,100 | $50,000 | $178,100 |
| 2024 | $5,120 | $218,000 | $0 | $0 |
| 2023 | $4,359 | $207,900 | $0 | $0 |
| 2022 | $4,259 | $197,800 | $50,000 | $147,800 |
| 2021 | $4,596 | $194,733 | $0 | $0 |
| 2020 | $4,105 | $191,667 | $0 | $0 |
| 2019 | $4,038 | $188,600 | $50,000 | $138,600 |
| 2018 | $4,104 | $188,600 | $50,000 | $138,600 |
| 2017 | $4,074 | $188,600 | $0 | $0 |
| 2016 | $4,485 | $188,800 | $0 | $0 |
| 2015 | $4,485 | $188,800 | $0 | $0 |
| 2014 | $4,485 | $188,800 | $0 | $0 |
Source: Public Records
Map
Nearby Homes
- 3039 E Baltimore St
- 5 N Ellwood Ave
- 3106 E Baltimore St
- 102 N Ellwood Ave
- 112 N Decker Ave
- 23 S Decker Ave
- 3111 E Baltimore St
- 122 N Ellwood Ave
- 119 N Curley St
- 28 S Potomac St
- 149 N Potomac St
- 128 N Curley St
- 162 N Decker Ave
- 108 S Ellwood Ave
- 18 S East Ave
- 3200 E Fairmount Ave
- 2820 E Baltimore St
- 112 S Ellwood Ave
- 3018 E Fayette St
- 122 S Potomac St
- 10 N Decker Ave
- 8 N Decker Ave
- 12 N Decker Ave
- 6 N Decker Ave
- 12 1/2 N Decker Ave
- 4 N Decker Ave
- 14 N Decker Ave
- 2 N Decker Ave
- 16 N Decker Ave
- 18 N Decker Ave
- 20 N Decker Ave
- 7 N Potomac St
- 9 N Potomac St
- 11 N Potomac St
- 3 N Potomac St
- 22 N Decker Ave
- 13 N Potomac St
- 1 N Potomac St
- 15 N Potomac St
- 24 N Decker Ave