
J
Seller's Agent in 2025
Jody Cox
Naples Realty Group, LLC
(860) 930-0681
10 in this area
232 Total Sales
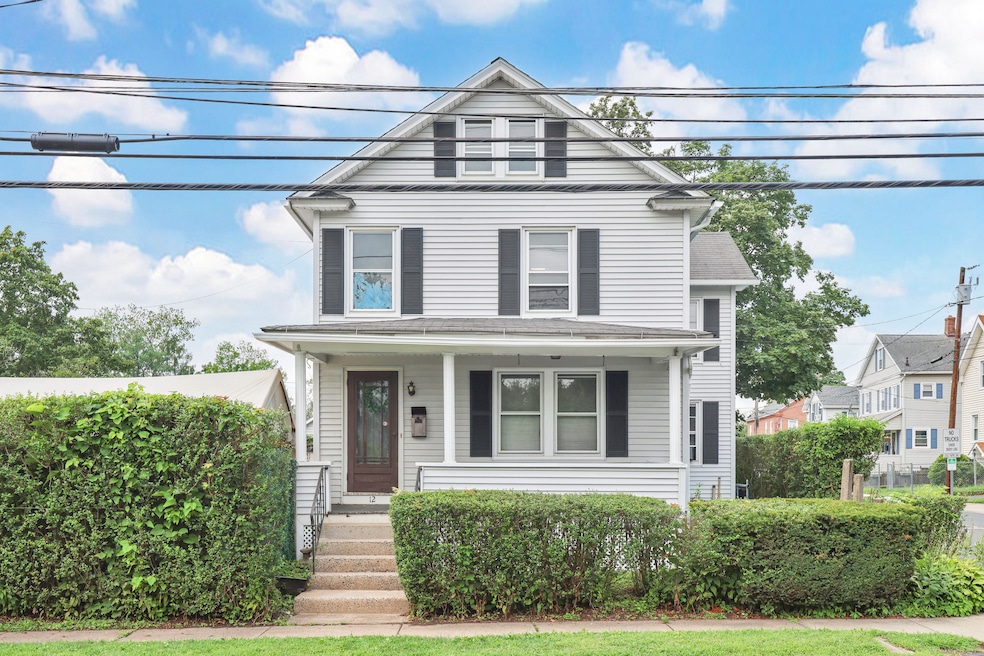
Experience the delightful character of this captivating 3-bedroom antique colonial, where historic elegance blends seamlessly with contemporary comfort. Upon entering, you'll be greeted by beautiful wood flooring that flows throughout the home, leading you into a cozy living room and a charming dining area, perfect for enjoying meals with loved ones or hosting gatherings. The finished lower level offers versatile space for entertainment or a home office, while the walk-up attic presents a fantastic opportunity for storage or potential expansion. Outside, the serene private yard serves as a perfect sanctuary for relaxation or outdoor fun. With a detached one-car garage and convenient access to the bus line and highway, this home is ideally situated for easy commuting. Seize the chance to make this remarkable property yours! New roof just installed! Being sold as is, priced accordingly.
| Date | Type | Sale Price | Title Company |
|---|---|---|---|
| Executors Deed | $166,000 | -- | |
| Deed | $85,200 | -- |
| Date | Status | Loan Amount | Loan Type |
|---|---|---|---|
| Open | $165,825 | Stand Alone Refi Refinance Of Original Loan | |
| Closed | $170,003 | VA | |
| Closed | $171,450 | VA |
| Date | Event | Price | List to Sale | Price per Sq Ft |
|---|---|---|---|---|
| 09/30/2025 09/30/25 | Sold | $250,000 | +4.2% | $174 / Sq Ft |
| 08/25/2025 08/25/25 | Pending | -- | -- | -- |
| 08/18/2025 08/18/25 | For Sale | $239,900 | -- | $167 / Sq Ft |
| Year | Tax Paid | Tax Assessment Tax Assessment Total Assessment is a certain percentage of the fair market value that is determined by local assessors to be the total taxable value of land and additions on the property. | Land | Improvement |
|---|---|---|---|---|
| 2025 | $3,867 | $161,210 | $47,110 | $114,100 |
| 2024 | $2,543 | $90,370 | $31,010 | $59,360 |
| 2023 | $2,379 | $90,370 | $31,010 | $59,360 |
| 2022 | $2,334 | $90,370 | $31,010 | $59,360 |
| 2021 | $2,334 | $90,370 | $31,010 | $59,360 |
| 2020 | $2,334 | $90,370 | $31,010 | $59,360 |
| 2019 | $2,334 | $90,370 | $31,010 | $59,360 |
| 2017 | $2,519 | $94,500 | $30,900 | $63,600 |
| 2016 | $2,519 | $94,500 | $30,900 | $63,600 |
| 2015 | $2,532 | $94,500 | $30,900 | $63,600 |
| 2014 | $2,891 | $110,200 | $35,100 | $75,100 |
J
Seller's Agent in 2025
Jody Cox
Naples Realty Group, LLC
(860) 930-0681
10 in this area
232 Total Sales
A
Buyer's Agent in 2025
AJ Davis
Executive Real Estate
(203) 848-8096
1 in this area
33 Total Sales
Source: SmartMLS
MLS Number: 24116830
APN: WINL-000021-000016-000003
Disclaimer: Certain information contained herein is derived from information provided by parties other than Homes.com. All information provided is deemed reliable, but is not guaranteed to be accurate and should be independently verified.
![]() IDX information is provided exclusively for personal, non-commercial use, and may not be used for any purpose other than to identify prospective properties consumers may be interested in purchasing. Information is deemed reliable but not guaranteed.
IDX information is provided exclusively for personal, non-commercial use, and may not be used for any purpose other than to identify prospective properties consumers may be interested in purchasing. Information is deemed reliable but not guaranteed.