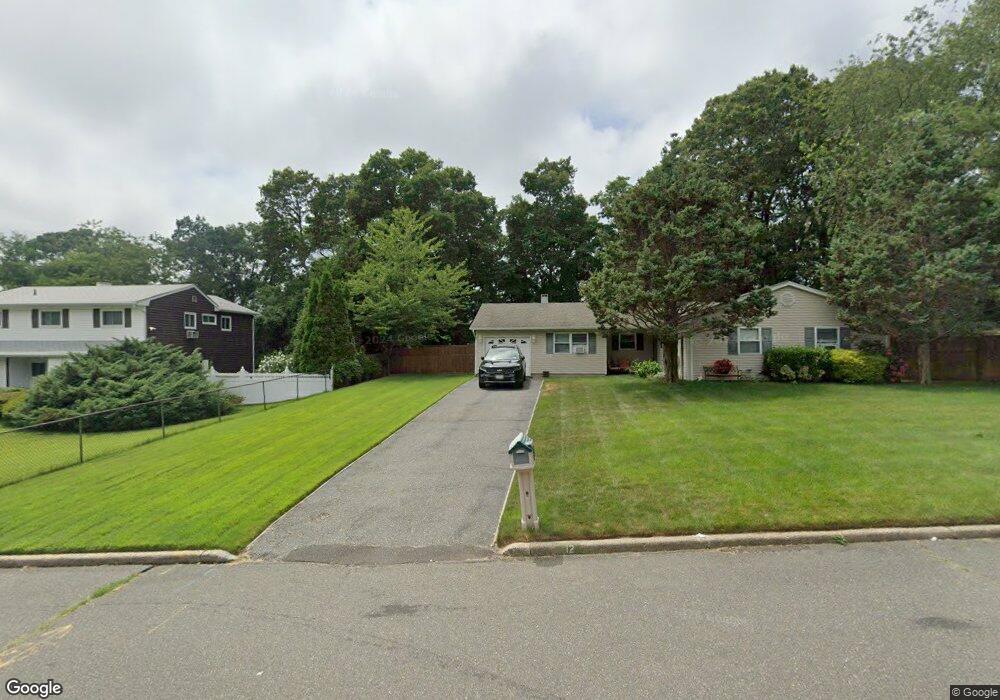
12 N Morris Ave Farmingville, NY 11738
Estimated Value: $616,000 - $716,000
3
Beds
1
Bath
1,507
Sq Ft
$430/Sq Ft
Est. Value
About This Home
This home is located at 12 N Morris Ave, Farmingville, NY 11738 and is currently estimated at $647,971, approximately $429 per square foot. 12 N Morris Ave is a home located in Suffolk County with nearby schools including Chippewa Elementary School, Sagamore Middle School, and Sachem High School East.
Ownership History
Date
Name
Owned For
Owner Type
Purchase Details
Closed on
Sep 29, 2004
Sold by
Giglio Joseph Thomas
Bought by
Powell Mark
Current Estimated Value
Purchase Details
Closed on
Jul 22, 1999
Sold by
Maltempo Patricia
Bought by
Giglio Joseph Thomas and Giglio Kelly Lynn
Home Financials for this Owner
Home Financials are based on the most recent Mortgage that was taken out on this home.
Original Mortgage
$142,650
Interest Rate
7.85%
Create a Home Valuation Report for This Property
The Home Valuation Report is an in-depth analysis detailing your home's value as well as a comparison with similar homes in the area
Home Values in the Area
Average Home Value in this Area
Purchase History
| Date | Buyer | Sale Price | Title Company |
|---|---|---|---|
| Powell Mark | $355,000 | Robin Long | |
| Giglio Joseph Thomas | $158,500 | Fidelity National Title Ins |
Source: Public Records
Mortgage History
| Date | Status | Borrower | Loan Amount |
|---|---|---|---|
| Previous Owner | Giglio Joseph Thomas | $142,650 |
Source: Public Records
Tax History Compared to Growth
Tax History
| Year | Tax Paid | Tax Assessment Tax Assessment Total Assessment is a certain percentage of the fair market value that is determined by local assessors to be the total taxable value of land and additions on the property. | Land | Improvement |
|---|---|---|---|---|
| 2024 | $10,140 | $2,905 | $300 | $2,605 |
| 2023 | $10,140 | $2,905 | $300 | $2,605 |
| 2022 | $8,333 | $2,905 | $300 | $2,605 |
| 2021 | $8,333 | $2,905 | $300 | $2,605 |
| 2020 | $9,251 | $2,905 | $300 | $2,605 |
| 2019 | $9,251 | $0 | $0 | $0 |
| 2018 | -- | $2,905 | $300 | $2,605 |
| 2017 | $8,610 | $2,905 | $300 | $2,605 |
| 2016 | $8,566 | $2,905 | $300 | $2,605 |
| 2015 | -- | $2,905 | $300 | $2,605 |
| 2014 | -- | $2,905 | $300 | $2,605 |
Source: Public Records
Map
Nearby Homes