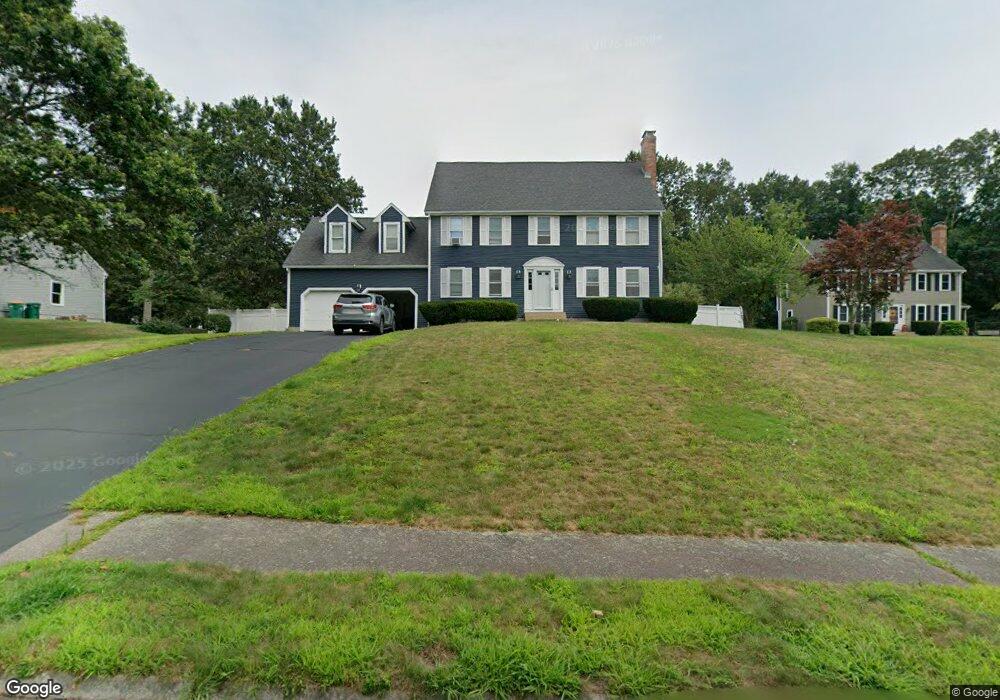
12 Nelson Way Mansfield, MA 02048
Estimated Value: $811,269 - $923,000
4
Beds
3
Baths
2,468
Sq Ft
$353/Sq Ft
Est. Value
About This Home
This home is located at 12 Nelson Way, Mansfield, MA 02048 and is currently estimated at $870,817, approximately $352 per square foot. 12 Nelson Way is a home located in Bristol County with nearby schools including Everett W. Robinson Elementary School, Jordan/Jackson Elementary School, and Harold L. Qualters Middle School.
Ownership History
Date
Name
Owned For
Owner Type
Purchase Details
Closed on
Sep 14, 2018
Sold by
Galanis Jean M
Bought by
Eitas Carly R and Eitas Timothy K
Current Estimated Value
Home Financials for this Owner
Home Financials are based on the most recent Mortgage that was taken out on this home.
Original Mortgage
$436,000
Outstanding Balance
$377,125
Interest Rate
4.6%
Mortgage Type
New Conventional
Estimated Equity
$493,692
Purchase Details
Closed on
Oct 12, 2010
Sold by
Sexton John and Galanis Jean M
Bought by
Galanis Jean M
Create a Home Valuation Report for This Property
The Home Valuation Report is an in-depth analysis detailing your home's value as well as a comparison with similar homes in the area
Home Values in the Area
Average Home Value in this Area
Purchase History
| Date | Buyer | Sale Price | Title Company |
|---|---|---|---|
| Eitas Carly R | $545,000 | -- | |
| Galanis Jean M | -- | -- |
Source: Public Records
Mortgage History
| Date | Status | Borrower | Loan Amount |
|---|---|---|---|
| Open | Eitas Carly R | $436,000 |
Source: Public Records
Tax History
| Year | Tax Paid | Tax Assessment Tax Assessment Total Assessment is a certain percentage of the fair market value that is determined by local assessors to be the total taxable value of land and additions on the property. | Land | Improvement |
|---|---|---|---|---|
| 2025 | $9,320 | $707,700 | $278,100 | $429,600 |
| 2024 | $9,222 | $683,100 | $290,200 | $392,900 |
| 2023 | $8,922 | $633,200 | $290,200 | $343,000 |
| 2022 | $8,574 | $565,200 | $268,600 | $296,600 |
| 2021 | $8,313 | $541,200 | $223,900 | $317,300 |
| 2020 | $8,184 | $532,800 | $223,900 | $308,900 |
| 2019 | $7,583 | $498,200 | $186,500 | $311,700 |
| 2018 | $7,534 | $483,900 | $177,800 | $306,100 |
| 2017 | $7,065 | $470,400 | $172,800 | $297,600 |
| 2016 | $6,822 | $442,700 | $164,500 | $278,200 |
| 2015 | $6,642 | $428,500 | $164,500 | $264,000 |
Source: Public Records
Map
Nearby Homes
- 128 Tremont St
- 24 Maverick Dr
- 14 Claire Ave
- 150 Gilbert St
- 1769 West St
- 17 Childs Ln
- 25 Shepherd St
- 2 Oak St Unit 2B
- 451R Gilbert St
- 25 Munroe Dr
- 401 South St
- 9 Coach Rd
- 84 Messenger St
- 40 Treasure Island Rd
- 49 Pheasant Hill Rd
- 16 Treasure Island Rd
- 33 Colonial Way
- 346 South St
- 115 Westfield Dr
- 166 Chauncy St
Your Personal Tour Guide
Ask me questions while you tour the home.