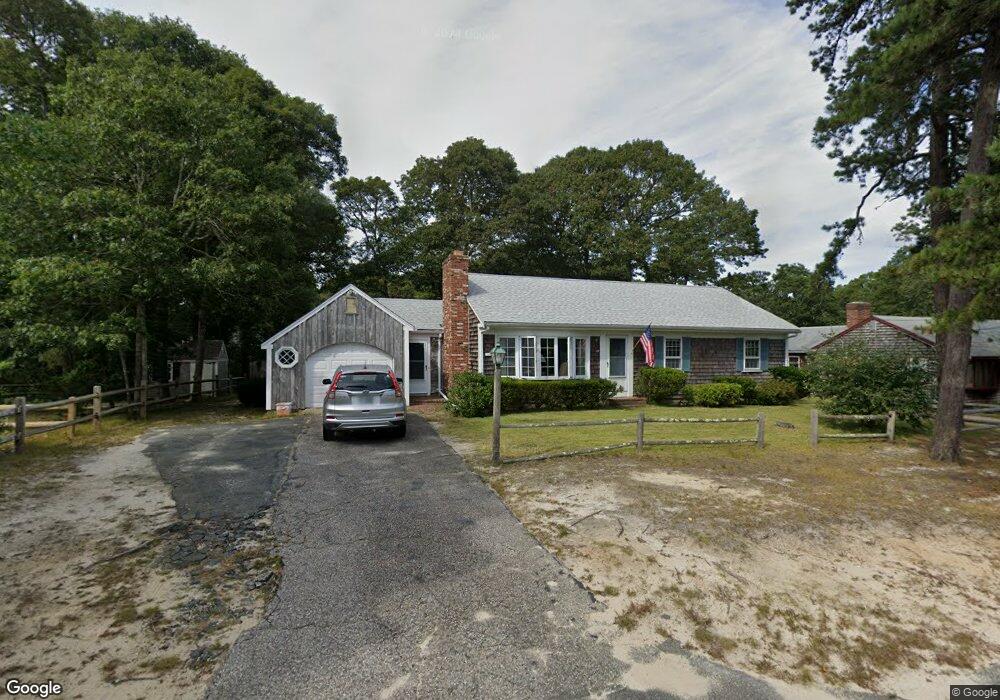
12 Norseman Dr South Dennis, MA 02660
South Dennis NeighborhoodEstimated Value: $592,367 - $698,000
4
Beds
2
Baths
1,452
Sq Ft
$445/Sq Ft
Est. Value
About This Home
This home is located at 12 Norseman Dr, South Dennis, MA 02660 and is currently estimated at $646,092, approximately $444 per square foot. 12 Norseman Dr is a home located in Barnstable County with nearby schools including Dennis-Yarmouth Regional High School and St. Pius X. School.
Ownership History
Date
Name
Owned For
Owner Type
Purchase Details
Closed on
Apr 27, 1989
Sold by
Vreeland John Hjj
Bought by
Murray David S
Current Estimated Value
Home Financials for this Owner
Home Financials are based on the most recent Mortgage that was taken out on this home.
Original Mortgage
$234,000
Interest Rate
10.9%
Mortgage Type
Purchase Money Mortgage
Purchase Details
Closed on
Nov 5, 1980
Bought by
Jane M Ottaviano Irt
Create a Home Valuation Report for This Property
The Home Valuation Report is an in-depth analysis detailing your home's value as well as a comparison with similar homes in the area
Home Values in the Area
Average Home Value in this Area
Purchase History
| Date | Buyer | Sale Price | Title Company |
|---|---|---|---|
| Murray David S | $260,000 | -- | |
| Jane M Ottaviano Irt | -- | -- |
Source: Public Records
Mortgage History
| Date | Status | Borrower | Loan Amount |
|---|---|---|---|
| Closed | Jane M Ottaviano Irt | $234,000 |
Source: Public Records
Tax History Compared to Growth
Tax History
| Year | Tax Paid | Tax Assessment Tax Assessment Total Assessment is a certain percentage of the fair market value that is determined by local assessors to be the total taxable value of land and additions on the property. | Land | Improvement |
|---|---|---|---|---|
| 2025 | $2,484 | $573,700 | $134,500 | $439,200 |
| 2024 | $2,402 | $547,100 | $129,300 | $417,800 |
| 2023 | $2,322 | $497,300 | $117,500 | $379,800 |
| 2022 | $2,240 | $400,000 | $117,700 | $282,300 |
| 2021 | $1,246 | $351,900 | $115,300 | $236,600 |
| 2020 | $2,014 | $330,100 | $115,300 | $214,800 |
| 2019 | $1,962 | $318,000 | $124,400 | $193,600 |
| 2018 | $1,403 | $281,500 | $107,700 | $173,800 |
| 2017 | $1,697 | $276,000 | $107,700 | $168,300 |
| 2016 | $1,655 | $253,500 | $113,000 | $140,500 |
| 2015 | $1,622 | $253,500 | $113,000 | $140,500 |
| 2014 | $1,507 | $237,400 | $96,900 | $140,500 |
Source: Public Records
Map
Nearby Homes