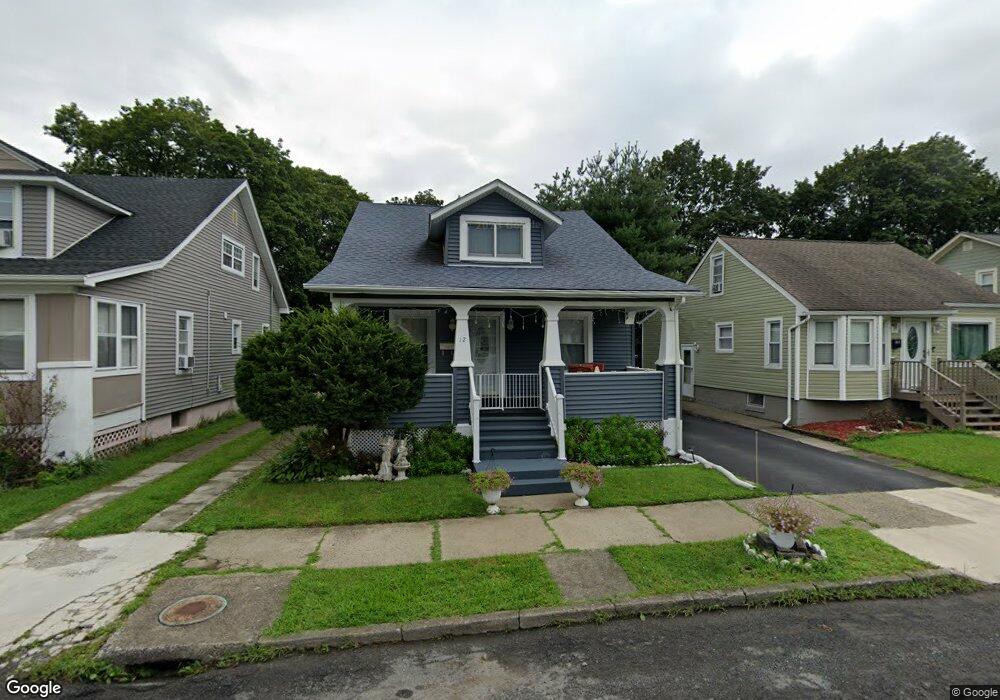
12 Nott Place Newburgh, NY 12550
Estimated Value: $325,400 - $384,000
3
Beds
1
Bath
1,392
Sq Ft
$246/Sq Ft
Est. Value
About This Home
This home is located at 12 Nott Place, Newburgh, NY 12550 and is currently estimated at $342,350, approximately $245 per square foot. 12 Nott Place is a home located in Orange County with nearby schools including Newburgh Free Academy Main Campus, Bishop Dunn Memorial, and Little Harvard.
Ownership History
Date
Name
Owned For
Owner Type
Purchase Details
Closed on
Jan 27, 2004
Sold by
Porter Michael F and Porter Christa
Bought by
Giron Veronica
Current Estimated Value
Purchase Details
Closed on
Jul 17, 2001
Sold by
Porter Michael
Bought by
Porter Michael F and Porter Christa L
Home Financials for this Owner
Home Financials are based on the most recent Mortgage that was taken out on this home.
Original Mortgage
$99,000
Interest Rate
6.99%
Purchase Details
Closed on
Sep 17, 1999
Sold by
Porter Michael and Vanesen Christopher Van
Bought by
Porter Michael
Create a Home Valuation Report for This Property
The Home Valuation Report is an in-depth analysis detailing your home's value as well as a comparison with similar homes in the area
Home Values in the Area
Average Home Value in this Area
Purchase History
| Date | Buyer | Sale Price | Title Company |
|---|---|---|---|
| Giron Veronica | $200,000 | Robert Rahemba | |
| Porter Michael F | -- | Fidelity National Title Ins | |
| Porter Michael | -- | -- |
Source: Public Records
Mortgage History
| Date | Status | Borrower | Loan Amount |
|---|---|---|---|
| Previous Owner | Porter Michael F | $99,000 |
Source: Public Records
Tax History Compared to Growth
Tax History
| Year | Tax Paid | Tax Assessment Tax Assessment Total Assessment is a certain percentage of the fair market value that is determined by local assessors to be the total taxable value of land and additions on the property. | Land | Improvement |
|---|---|---|---|---|
| 2024 | $7,701 | $256,300 | $40,500 | $215,800 |
| 2023 | $7,701 | $233,000 | $40,500 | $192,500 |
| 2022 | $9,024 | $211,200 | $17,900 | $193,300 |
| 2021 | $8,210 | $176,000 | $16,300 | $159,700 |
| 2020 | $5,813 | $167,600 | $16,300 | $151,300 |
| 2019 | $2,881 | $122,700 | $16,300 | $106,400 |
| 2018 | $2,881 | $122,700 | $19,300 | $103,400 |
| 2017 | $5,265 | $122,700 | $19,300 | $103,400 |
| 2016 | $4,886 | $113,600 | $19,300 | $94,300 |
| 2015 | -- | $113,600 | $19,300 | $94,300 |
| 2014 | -- | $113,600 | $19,300 | $94,300 |
Source: Public Records
Map
Nearby Homes