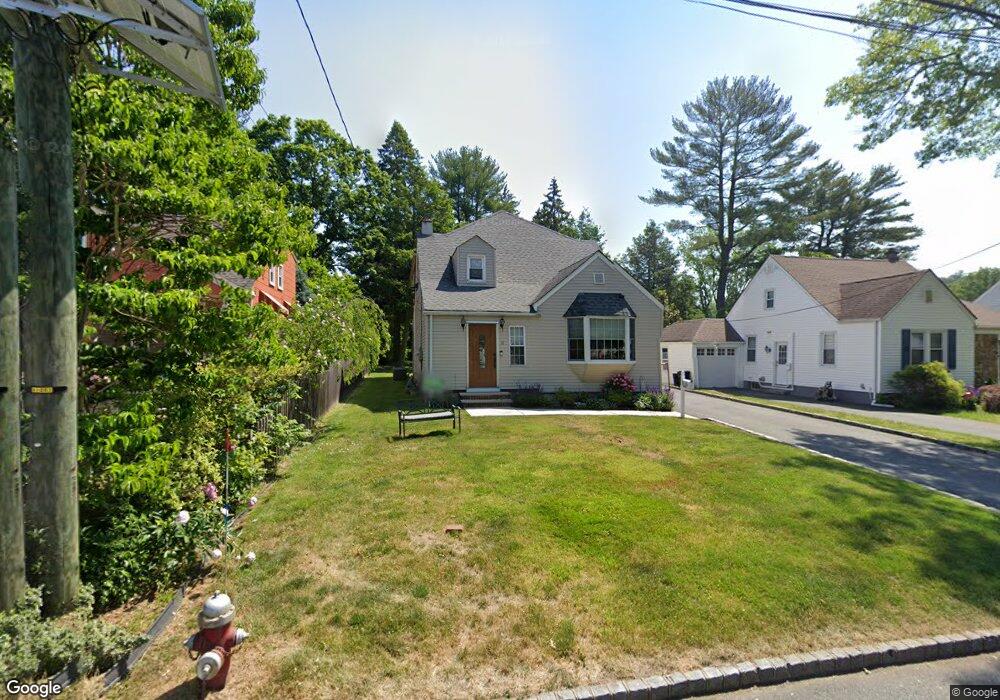
12 Oakwood Ave Livingston, NJ 07039
Estimated Value: $1,003,793 - $1,322,000
--
Bed
--
Bath
2,355
Sq Ft
$467/Sq Ft
Est. Value
About This Home
This home is located at 12 Oakwood Ave, Livingston, NJ 07039 and is currently estimated at $1,099,698, approximately $466 per square foot. 12 Oakwood Ave is a home located in Essex County with nearby schools including Livingston Sr High School, Aquinas Academy, and Golda Och Academy.
Ownership History
Date
Name
Owned For
Owner Type
Purchase Details
Closed on
Oct 14, 2004
Sold by
Dawson Rita
Bought by
Xtreme Properties Inc
Current Estimated Value
Purchase Details
Closed on
Jul 31, 1998
Sold by
Lim Joon Sik
Bought by
Sass Hal and Sass Susan
Home Financials for this Owner
Home Financials are based on the most recent Mortgage that was taken out on this home.
Original Mortgage
$148,400
Interest Rate
6.8%
Purchase Details
Closed on
Feb 17, 1994
Sold by
Hayashi Taketeru
Bought by
Lim Joon and Lim Keun
Home Financials for this Owner
Home Financials are based on the most recent Mortgage that was taken out on this home.
Original Mortgage
$117,000
Interest Rate
7.15%
Create a Home Valuation Report for This Property
The Home Valuation Report is an in-depth analysis detailing your home's value as well as a comparison with similar homes in the area
Home Values in the Area
Average Home Value in this Area
Purchase History
| Date | Buyer | Sale Price | Title Company |
|---|---|---|---|
| Xtreme Properties Inc | $104,000 | -- | |
| Sass Hal | $185,500 | -- | |
| Lim Joon | $156,000 | -- |
Source: Public Records
Mortgage History
| Date | Status | Borrower | Loan Amount |
|---|---|---|---|
| Previous Owner | Sass Hal | $148,400 | |
| Previous Owner | Lim Joon | $117,000 |
Source: Public Records
Tax History Compared to Growth
Tax History
| Year | Tax Paid | Tax Assessment Tax Assessment Total Assessment is a certain percentage of the fair market value that is determined by local assessors to be the total taxable value of land and additions on the property. | Land | Improvement |
|---|---|---|---|---|
| 2025 | $13,131 | $553,600 | $259,000 | $294,600 |
| 2024 | $13,131 | $553,600 | $259,000 | $294,600 |
| 2022 | $12,915 | $553,600 | $259,000 | $294,600 |
| 2021 | $12,810 | $553,600 | $259,000 | $294,600 |
| 2020 | $12,572 | $553,600 | $259,000 | $294,600 |
| 2019 | $11,628 | $444,500 | $249,000 | $195,500 |
| 2018 | $11,473 | $444,500 | $249,000 | $195,500 |
| 2017 | $11,321 | $444,500 | $249,000 | $195,500 |
| 2016 | $11,113 | $444,500 | $249,000 | $195,500 |
| 2015 | $10,948 | $444,500 | $249,000 | $195,500 |
| 2014 | $10,592 | $444,500 | $249,000 | $195,500 |
Source: Public Records
Map
Nearby Homes