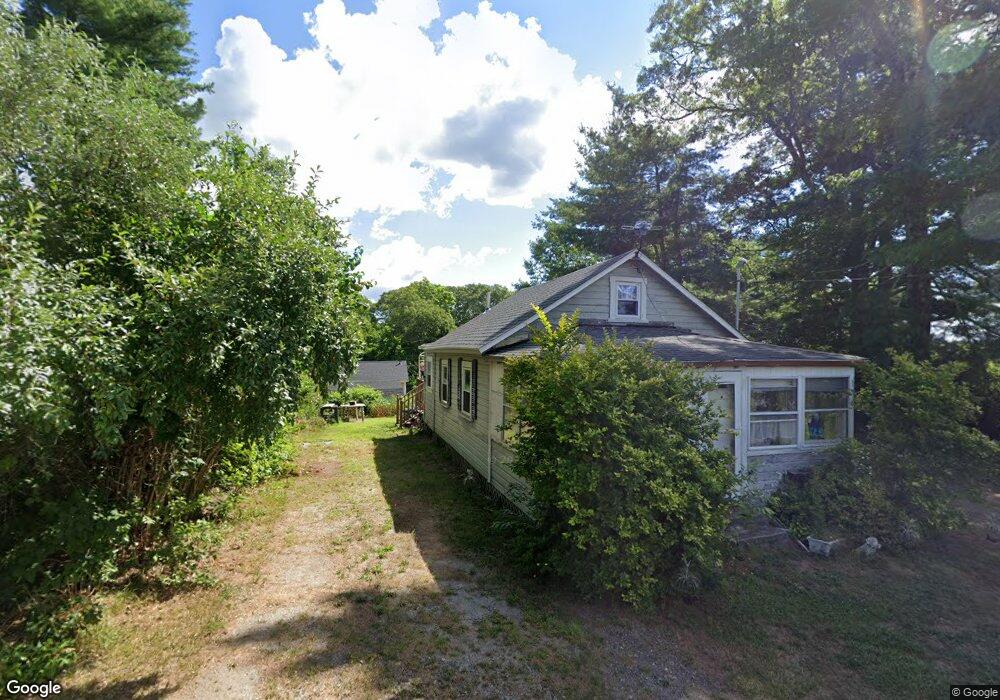
12 Osborne Ave West Wareham, MA 02576
Estimated Value: $185,000 - $306,000
2
Beds
1
Bath
486
Sq Ft
$527/Sq Ft
Est. Value
About This Home
This home is located at 12 Osborne Ave, West Wareham, MA 02576 and is currently estimated at $256,098, approximately $526 per square foot. 12 Osborne Ave is a home.
Ownership History
Date
Name
Owned For
Owner Type
Purchase Details
Closed on
Feb 15, 2013
Sold by
Larkin Eugene T Est and Larkin
Bought by
Starvish Mary and Starvish Eric
Current Estimated Value
Purchase Details
Closed on
Oct 10, 2006
Sold by
Tuller Joan C
Bought by
Tuller Ret and Tuller Jason C
Purchase Details
Closed on
Jul 3, 2003
Sold by
Paone George A and Paone Joan M
Bought by
Pfistner Deborah M and Paone Enrico J
Purchase Details
Closed on
Oct 29, 1993
Sold by
Morin Leon
Bought by
Spencer Barbara A and Tuller Joan
Create a Home Valuation Report for This Property
The Home Valuation Report is an in-depth analysis detailing your home's value as well as a comparison with similar homes in the area
Home Values in the Area
Average Home Value in this Area
Purchase History
| Date | Buyer | Sale Price | Title Company |
|---|---|---|---|
| Starvish Mary | $65,000 | -- | |
| Starvish Mary | $65,000 | -- | |
| Tuller Ret | -- | -- | |
| Tuller Ret | -- | -- | |
| Pfistner Deborah M | -- | -- | |
| Pfistner Deborah M | -- | -- | |
| Spencer Barbara A | $20,000 | -- | |
| Spencer Barbara A | $20,000 | -- |
Source: Public Records
Tax History Compared to Growth
Tax History
| Year | Tax Paid | Tax Assessment Tax Assessment Total Assessment is a certain percentage of the fair market value that is determined by local assessors to be the total taxable value of land and additions on the property. | Land | Improvement |
|---|---|---|---|---|
| 2025 | $1,647 | $158,100 | $95,400 | $62,700 |
| 2024 | $1,293 | $115,100 | $72,100 | $43,000 |
| 2023 | $1,207 | $107,900 | $62,300 | $45,600 |
| 2022 | $1,207 | $91,600 | $62,300 | $29,300 |
| 2021 | $1,084 | $80,600 | $62,300 | $18,300 |
| 2020 | $1,069 | $80,600 | $62,300 | $18,300 |
| 2019 | $965 | $72,600 | $56,000 | $16,600 |
| 2018 | $1,637 | $120,100 | $56,000 | $64,100 |
| 2017 | $1,525 | $113,400 | $56,000 | $57,400 |
| 2016 | $1,388 | $102,600 | $53,200 | $49,400 |
| 2015 | $1,341 | $102,600 | $53,200 | $49,400 |
| 2014 | $1,223 | $95,200 | $49,800 | $45,400 |
Source: Public Records
Map
Nearby Homes
- 12 Taft St
- 26 Washington Dr
- 21 Windsor Dr
- 929 Point Rd
- 174 Wareham Rd
- 0 Cromesett Rd (Off) Unit 73385395
- 5 Sola's Cir
- 6 A Rock Marsh Rd Unit A
- 6 A Rock Marsh Rd Unit A
- 58 Shady Ln
- 233 Marion Rd
- 4 Rebecca Dr
- 119 County Rd
- Lot 77E Seahorse
- Lot 77D Seahorse
- 127 County Rd
- 245 Wareham Rd
- 7 Seahorse Way
- 21 Weston Ave
- 4 Bachant Way